
Key Takeaways
The stock market had a good first quarter, returning +7% despite the turmoil in the banking industry.
The growth in the jobs market is slowing down compared to 2021-2022, but still grew at healthy 3% annualized.
Inflation continues to trend down with 5% year-over-year growth in March.
The Conference Board Leading Economic Index® fell again in February, still indicating a mild recession later in 2023.
Market review
Markets started 2023 on a good note after positive inflation and jobs reports in January. However, when Fed’s chair Jerome Powell made several public comments about the need for high interest rates and when Silicon Valley Bank failed in March, the volatility and fears of deep recession quickly returned. Overall, stocks were able to recover some of the losses and closed the quarter at +7%[1]. International developed stocks had a similar performance at +8%[2] with their own share of banking troubles following the takeover of Credit Suisse by UBS. Lagging were emerging markets with a return of +4% and global real estate at 1.3% for the past 3 months.[3] Looking closer at US stocks, value underperformed growth, and smaller companies underperformed their larger peers, a reversal from the end of 2022 where value outperformed growth[4].

Market Performance [Source: Quarterly Market Review First quarter 2023 by Dimensional Fund Advisors LP] [5]
Expectations for lower interest rates toward the end of quarter pushed the yields lower across most of the maturities (except the ultra-short term), with the biggest drop of -0.379% in 5 Year yield to 3.6%[6]. This helped bonds to return almost 3%, an above average return compared to the 0.9% average from 2001-2023[7]. Recent months also helped bonds to regain some of their hedging ability relative to the stocks, as the correlation between bonds and stocks dropped to 0.21 from 0.5 highs in mid-2022[8]. When correlation is high like it was last year, bonds and stocks fall together. While correlation is not yet back at its 20-year average of -0.02[9], it’s an improvement welcomed in many portfolios with bonds.

Weekly return correlation between bonds and stocks [10] [Source: Morningstar]
Commodities, which are often used to hedge some of the inflation, reversed their gains from Q4 2022 and lost overall -5%[11]. The worst performing were energy related commodities like natural gas that lost -51% or heating oil at -14%[12]. While commodities are highly volatile and pushed down by fears of recession and slowing demand, the recent announcement in early April from OPEC to cut its production by additional 1.16[13] million barrels per day, already boosted their prices, an unwelcomed trend when fighting high inflation.
Economy
Jobs market continues to trend downward since its highs back in 2021, with employment growth for first quarter at 3%[14], but still growing overall, a good sign for the economy. The strongest growth was again in healthcare & leisure at 4.7% followed by the governmental sector, while the weakest growth was in manufacturing and mining[15]. Signs of slowdown are visible also in wage growth where the annualized average for the past 3 months reached 3.2%[16].

Nonfarm Payroll Employment by Morningstar [17]
Recent inflation reports show signs that improvement from the second half of 2022 was not only a temporary thing. Inflation in March dropped to 5%[18] year-over-year, back to levels from May 2021. One of the remaining pockets of inflation is still food at 8.5% and services (less energy services) at 7.1% of which the largest contributor is shelter (housing) representing around 34% of the overall CPI components[19]. Shelter reached 8.2%[20] year-over-year in March, the highest reading of the current cycle.
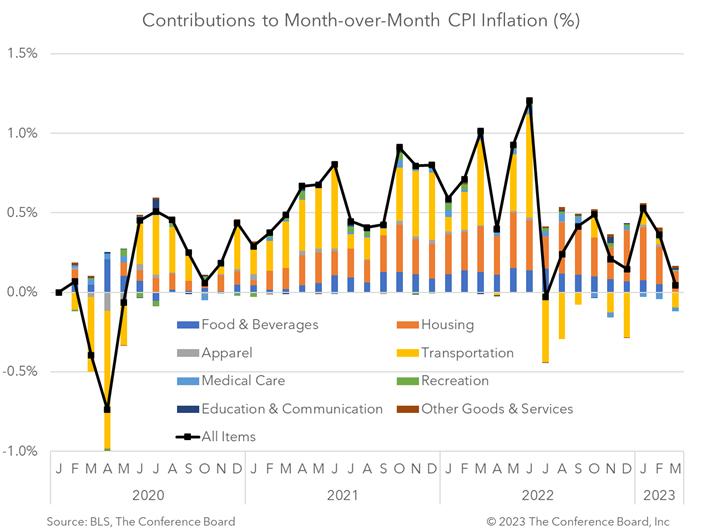
Contributions to Month-over-Month CPI Inflation by The Conference Board [21]
Shelter CPI has historically lagged home prices by four quarters and even though there are good signs that rental market is cooling down quickly according to Zillow, it might take some time until this drop is fully reflected in CPI numbers. The most recent March numbers from Zillow for observed rent is 5.95% year-over-year growth, a significant drop from its 16.93% peak in February of 2022. [22]

US Zillow Observer Rent vs US Consumer Price Index: Shelter by MacroMicro [23]
The Fed’s goal to reduce inflation while maintaining financial stability by monetary tightening came under pressure during the recent failure of Silicon Valley Bank (SVB) and Signature Bank. While both banks had underlying issues, a classic run on a bank, where too many depositors withdraw money at same time, brought them down almost overnight. One of the reasons why SVB depositors lost confidence is it had to realize a large loss on a portfolio of fixed income securities to cover the outflow of deposits, something that majority of banks have been dealing with since fall of 2022[24]. While SVB was unique due to its heavy exposure to technology startups that have had a hard time lately, and a large portion of uninsured deposits reaching 97%, compared to average of 52% for all banks[25], the interest rate and liquidity risk is something that all banks must manage well during tightening financial conditions. The rapid interest rate hikes in the past year reduced the value of assets for many banks, especially the ones with longer maturity. When a bank is forced to sell these securities to cover withdrawals, it realizes losses which in the case of SVB were significant and created a panic and run on the bank. The withdrawals just during Thursday the 10th amounted to $42 billion[26], a liquidity problem that SVB was not able to handle considering that it ended 2022 with around $175 billion in deposits[27]. These problems within the banking industry can quickly trickle down to the rest of the economy as banks will reduce lending to shore up their own financial health and liquidity. This additional credit crunch on top of the already tight financial conditions[28] witnessed earlier this year can push demand along with inflation even lower in the coming months.
Capital Markets Liquidity as measured by IPOs, high yield bond issuance, and leveraged loan issuance - by Kohlberg Kravis Roberts & Co. L.P. [29]
To see how all of this might affect the economy, we can look at the Conference Board Leading Economic Index ®. With eight out of ten components being negative, the whole index fell 0.3%[30] in February, the 11th consecutive monthly decline. While the rate of decline is slowing down, it keeps pointing to mild recession later in 2023, something that Fed expects too[31]. Even with some recession, the GDP is still expected to grow for the full year 2023 at 0.4%[32] as estimated by Fed and 0.7%[33] estimated by The Conference Board.
Uncertainty is unavoidable, but having a plan helps
Recent banking turmoil shows how quickly uncertainty becomes a headline and worries about recession and financial stability are everywhere around us. At times like this it is good to remember our long-term game plan so we can stay put on its course. If you have any questions or would like to touch up on your plan, feel free to reach out to us.
Author: Richard Toth, CFA
References
[1-4] Source: Quarterly Market Review First quarter 2023 by Dimensional Fund Advisors LP
[5] US Stock Market (Russell 3000 Index), International Developed Stocks (MSCI World ex USA Index [net dividends]), Emerging Markets (MSCI Emerging Markets Index [net dividends]),Global Real Estate (S&P Global REIT Index [net dividends]), Commodities (The Bloomberg Commodity Total Return Index), US Bond Market (Bloomberg US Aggregate Bond Index), Global Bond Market ex US (Bloomberg Global Aggregate ex-USD Bond Index [hedged to USD]).
[6-7] Source: Quarterly Market Review First quarter 2023 by Dimensional Fund Advisors LP
[8-9] Source: Morningstar
[10] Stocks represented by Russel 3000 TR USD index and bonds by Bloomberg US Agg Bond TR USD index.
[11-12] Source: Quarterly Market Review First quarter 2023 by Dimensional Fund Advisors LP
[13] Source: https://www.reuters.com/business/energy/sarabia-other-opec-producers-announce-voluntary-oil-output-cuts-2023-04-02/
[14-17] Source: https://office.morningstar.com/research/doc/1149096/Strong-March-Jobs-Report-Shows-the-Fed-Still-Has-Clearance-to-Hike-Interest-Rates
[18-20] Source: U.S. BUREAU OF LABOR STATISTICS
[21] Source: https://www.conference-board.org/blog/global-economy/CPI-march-2023
[22-23] Source: https://en.macromicro.me/collections/5/us-price-relative/49740/us-cpi-rent-zillow-rent-yoy
[24-25] Source: Morningstar U.S. Economic Pulse: March 2023
[26] Source: https://www.cnbc.com/2023/03/28/svb-customers-tried-to-pull-nearly-all-deposits-in-two-days-barr-says.html
[27] Source: https://www.fdic.gov/news/press-releases/2023/pr23016.html#:~:text=As%20of%20December%2031%2C%202022,%24175.4%20billion%20in%20total%20deposits.
[28-29] Source: https://www.kkr.com/global-perspectives/kkr-blog/search-capital-just-became-all-out-hunt
[30] Source: https://www.conference-board.org/topics/us-leading-indicators
[26] Source: https://www.nbcnews.com/business/economy/mild-recession-now-likely-year-federal-reserve-says-rcna79405
[31-32] Source: https://www.nbcnews.com/business/economy/mild-recession-now-likely-year-federal-reserve-says-rcna79405
[33] Source: https://www.conference-board.org/research/us-forecast
Disclosures
VanderPol Investments, LLC (“VPI”) is a registered investment adviser located in Michigan. VPI may only transact business in those states in which it is registered, or qualifies for an exemption or exclusion from registration requirements.
This presentation is limited to the dissemination of general information regarding VPI’s investment advisory services. Accordingly, the information in this presentation should not be construed, in any manner whatsoever, as a substitute for personalized individual advice from VPI. Information presented is for educational purposes only and does not intend to make an offer or solicitation for the sale or purchase of any specific securities, investments, or investment strategies. Investments involve risk and unless otherwise stated, are not guaranteed. Be sure to first consult with a qualified financial adviser and/or tax professional before implementing any strategy discussed herein. Any client examples were hypothetical and used to demonstrate a concept.
Past performance is not indicative of future performance. Therefore, no current or prospective client should assume that future performance of any specific investment, investment strategy (including the investments and/or investment strategies recommended by VPI), or product referenced directly or indirectly in this presentation, will be profitable. Different types of investments involve varying degrees of risk, & there can be no assurance that any specific investment or investment strategy will suitable for a client’s or prospective client’s investment portfolio.
Various indexes were chosen that are generally recognized as indicators or representation of the stock market in general. Indices are typically not available for direct investment, are unmanaged and do not include fees or expenses. Some indices may also not reflect reinvestment of dividends.
VPI may discuss and display, charts, graphs, formulas which are not intended to be used by themselves to determine which securities to buy or sell, or when to buy or sell them. Such charts and graphs offer limited information and should not be used on their own to make investment decisions.
