
Key Takeaways
Markets climbed as U.S. stocks hit fresh highs on low volatility.
Emerging markets outperformed, helped by Asia’s AI/semiconductor strength and a China tech rebound.
Gold and crypto reached all time highs.
Growth and AI leaders kept the edge.
The U.S. economy stayed resilient with Q3 GDP tracking near 3.8%.
Tariff rules steadied, while fiscal deficits remain a watchpoint.
Market review
Markets delivered another strong quarter for investors, this time with very little volatility, a sharp contrast to the volatility spike back in April. Several major indices reached fresh all-time highs in Q3, continuing the momentum we’ve seen all year. Following the S&P 500’s breakout in Q1 and the Nasdaq’s in Q2, the Dow Jones finally breached in Q3 its previous peak from 2024, along with the small-cap Russell 2000 and Japan’s Nikkei 225. China remains a notable outlier, as the Shanghai Composite is still more than 30% below its 2007 peak despite better performance in 2025.
The U.S. stock market returned 8.2%[1] in Q3, bringing the year-to-date gain to 14.4%, close to the historical annual average over the past 15 years[2]. This strong quarter helped the U.S. edge back into the lead globally, with a 12-month return of 17.41%, just ahead of emerging markets (17.3%) and developed markets (16.06%)[3]. Emerging markets were the top performers in Q3 with a 10.6%[4] return, supported by easier global financial conditions after the Fed’s cut, a China tech rebound and overall strength across North Asia’s AI/semiconductor supply chain. Developed markets held their own, returning 5.3%[5] for the quarter.

Market Performance [Source: Quarterly Market Review – Third Quarter 2025 by Dimensional Fund Advisors] [6]
Outside of traditional equities, gold reached a double digit growth with 15% in Q3. Building on its bull run, its price has doubled over the past two years as investors and central banks are looking for a store of value in uncertain times. Bitcoin, often compared to digital gold, also kept its momentum along with other crypto assets. With 13.5% gain in Q3[7], crypto megacap index gained 76% in past 12 months, a clear leader among all the major asset classes. As the crypto space matures and adoption grows, we've expanded coverage in our portfolios. Starting this quarter, crypto exposure is now available in our moderate portfolios, in addition to our aggressive ones offered in 2024. The allocation remains modest, but even at low levels, it can enhance diversification and boost long-term return potential.
AI remained the market’s dominant narrative, with companies and countries racing to establish leadership. We saw major announcements across the board, from new funding rounds to infrastructure buildouts and long-term purchase agreements. Venture funding globally hit $97 billion[8], up 38% year-over-year, with AI-related deals accounting for 46% of that total. The largest check went to Anthropic, which raised $13 billion in a single round. Meanwhile, the data center boom on the physical side continues at full speed. The latest update from Stargate Project (OpenAI, Oracle, SoftBank) points to nearly 7 gigawatts of planned capacity and over $400 billion in expected investment over the next three years[9].
With markets reaching all-time highs and valuations stretched now more than one standard deviation above long-term averages[10], many investors are wondering how long we can keep going? While the long-term growth of the U.S. and global economy remains highly likely, strong recent performance and high valuations raise the odds of episodic volatility and drawdowns. Our tactical view remains constructively cautious. Now is not the time to chase performance or increase risk allocation without consideration. Instead, we continue to emphasize diversification across regions and asset classes, exposure to value stocks as a counterbalance to growth, and potentially increasing bond allocation to manage downside risk and have room to add risk opportunistically when the odds are favorable.
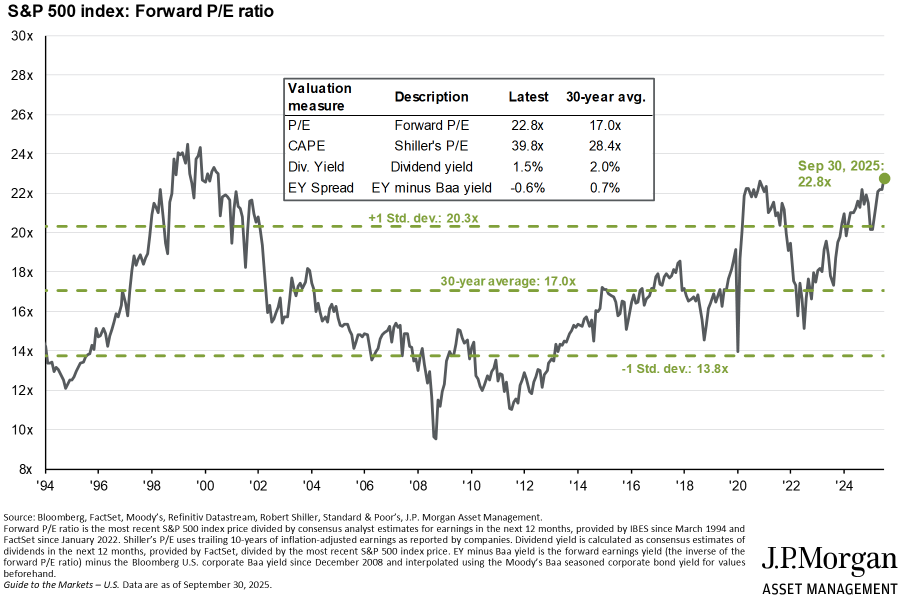
Chart by J.P.Morgan Asset Management [Source: https://am.jpmorgan.com/us/en/asset-management/institutional/insights/market-insights/guide-to-the-markets/guide-to-the-markets-slides-us/equities/gtm-forwardpe/]
Bond markets had a relatively steady quarter. In the U.S., yields declined across the curve, with 10 Year yields continuing the downward trend from their 4.59%[11] highs in May. The 10-year Treasury yield finished Q3 at 4.15%, slightly below where it started the quarter at 4.22%[12]. While the longer-term U.S. yields have eased recently, they remain higher than a year ago, reflecting persistent concerns over global debt levels and fiscal sustainability. Investors are demanding more compensation for locking in long-term debt, particularly as governments continue to run elevated deficits. Outside the U.S., yields generally moved slightly higher, but relative to the start of the year, most global bond markets have remained stable.
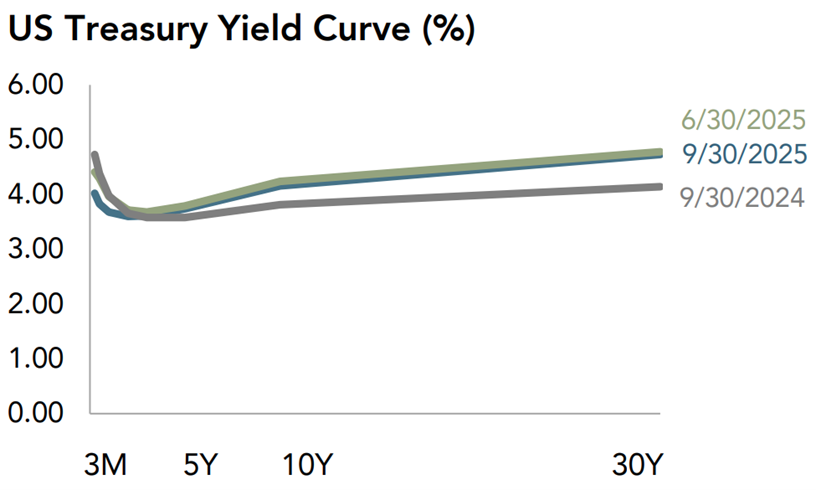
Chart by Dimensional Fund Advisors [Source: Quarterly Market Review – Third Quarter 2025 by Dimensional Fund Advisors]
Economy
Similar to the stock market, the U.S. economy is expected to deliver another solid quarter of growth in Q3. The Atlanta Fed’s GDPNow model currently points to about 3.8%[13] for Q3, following a healthy 3.8%[14] expansion in Q2 that partially reflected a rebound from a weak Q1.
While GDP growth continues at a healthy pace, the labor market has most likely been cooling. Revisions show job creation slowing meaningfully from post‑COVID peaks. Notably, the June data shows U.S. economy with a net loss of 13,000 jobs[15], the first negative print in several years. This shift, alongside with inflation holding between 2.3% (April) and 3.0% (January)[16], set the stage for the Fed’s first 2025 rate cut after nearly a year-long pause, lowering the policy rate to 4.00%–4.25% in September.
With unemployment ticking up only modestly to 4.3%[17], recent research from the Federal Reserve[18] suggests that this cooling does not necessarily indicate economic weakness. A sharp reversal in immigration trends, coupled with cyclical shifts in labor force participation, has caused the breakeven employment rate, the number of jobs needed per month to maintain labor market balance, to drop from around 250,000 in 2023 to just 30,000 by mid-2025[19]. In that light, today’s modest job growth may still reflect a labor market that’s in balance, not in trouble.

Chart by the Federal Reserve Bank of Dallas [Source: https://www.dallasfed.org/research/economics/2025/1009]
After a burst of rapid rule changes early in the summer, the tariff framework has stabilized in recent weeks, reducing some of the uncertainty many companies faced. By late Q3, the average applied U.S. tariff rate was around 16%–17%[20], a sharp increase from pre-2025 norms, with customs duty receipts hitting a monthly record in August (~$29–30B)[21]. With some rules clearer and more stable, companies that had been in wait-and-see mode could slowly begin making decisions on long-dated investments and supply-chain plans.
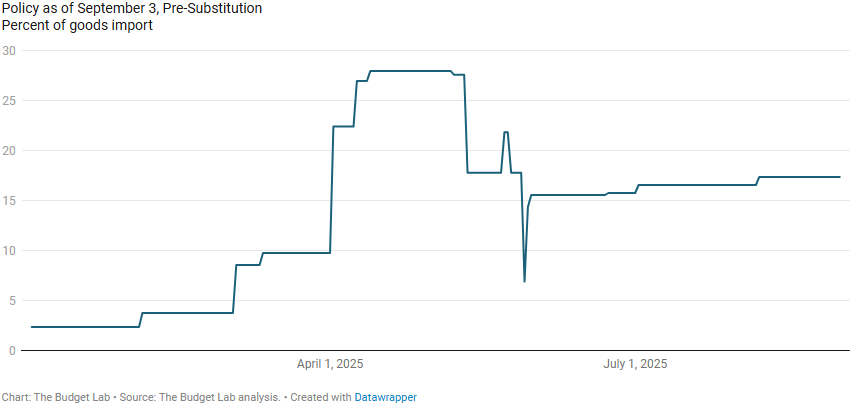
Chart by The Budget Lab [Source: https://budgetlab.yale.edu/research/state-us-tariffs-september-4-2025]
When data goes quiet
With the federal government shutdown now in its second week, the official data flow from jobs to other key releases, has gone quiet for now. That can be unsettling, but markets are taking it in stride. This temporary data blackout can offer a useful reset, nudging us to focus on the big picture rather than the noise of any single print. Let’s also use the pause to step back to review our own lives and financial plans before reacting to short-term data. Reach out to us if you’d like a second set of eyes, or when you decide it’s time to make a change.
Authors: Mark VanderPol, CFA, CFP; Richard Toth, CFA, CAIA; Noah Hoekstra, CFP
References
[1] Source: Quarterly Market Review – Third Quarter 2025 by Dimensional Fund Advisors
[2] 15 Year Annualized Return for Russel 3000 Index at 14.23% [Source: Quarterly Market Review – Third Quarter 2025 by Dimensional Fund Advisors]
[3-5] Source: Quarterly Market Review – Third Quarter 2025 by Dimensional Fund Advisors
[6] US Stock Market (Russell 3000 Index), International Developed Stocks (MSCI World ex USA Index [net dividends]), Emerging Markets (MSCI Emerging Markets Index [net dividends]),Global Real Estate (S&P Global REIT Index [net dividends]), Commodities (The Bloomberg Commodity Total Return Index), US Bond Market (Bloomberg US Aggregate Bond Index), Global Bond Market ex US (Bloomberg Global Aggregate ex-USD Bond Index [hedged to USD]), Crypto (S&P Cryptocurrency MegaCap Index)
[7] S&P Cryptocurrency MegaCap Index (holdings are Bitcoin + Ether)
[8] Source: https://www.reuters.com/business/ai-venture-funding-continued-surge-third-quarter-data-shows-2025-10-06/
[9] Source: https://openai.com/index/five-new-stargate-sites/
[10] Source: Charles Schwab - Quarterly Chartbook Q4 2025
[11-12] Source: https://www.cnbc.com/quotes/US10Y
[13] Federal Reserve Bank of Atlanta’s GDPNow as of October 7, 2025
[14] Source: U.S. Bureau of Economic Analysis
[15-17] Source: U.S. Bureau of Labor Statistics
[18-19] Federal Reserve Bank of Dallas [Source: https://www.dallasfed.org/research/economics/2025/1009]
[20] Source: The Budget Lab [https://budgetlab.yale.edu/research/state-us-tariffs-september-4-2025]
[21] Source: Monthly Treasury Statement by U.S. Department of The Treasury
Disclosures
VanderPol Investments, LLC (“VPI”) is a registered investment adviser located in Michigan. VPI may only transact business in those states in which it is registered, or qualifies for an exemption or exclusion from registration requirements.
This presentation is limited to the dissemination of general information regarding VPI’s investment advisory services. Accordingly, the information in this presentation should not be construed, in any manner whatsoever, as a substitute for personalized individual advice from VPI. Information presented is for educational purposes only and does not intend to make an offer or solicitation for the sale or purchase of any specific securities, investments, or investment strategies. Investments involve risk and unless otherwise stated, are not guaranteed. Be sure to first consult with a qualified financial adviser and/or tax professional before implementing any strategy discussed herein. Any client examples were hypothetical and used to demonstrate a concept.
Past performance is not indicative of future performance. Therefore, no current or prospective client should assume that future performance of any specific investment, investment strategy (including the investments and/or investment strategies recommended by VPI), or product referenced directly or indirectly in this presentation, will be profitable. Different types of investments involve varying degrees of risk, & there can be no assurance that any specific investment or investment strategy will suitable for a client’s or prospective client’s investment portfolio.
Various indexes were chosen that are generally recognized as indicators or representation of the stock market in general. Indices are typically not available for direct investment, are unmanaged and do not include fees or expenses. Some indices may also not reflect reinvestment of dividends.
VPI may discuss and display, charts, graphs, formulas which are not intended to be used by themselves to determine which securities to buy or sell, or when to buy or sell them. Such charts and graphs offer limited information and should not be used on their own to make investment decisions.
