
Key Takeaways
2026 started with momentum but ended more cautiously, as the late-quarter oil shock shifted attention away from growth enthusiasm and back toward inflation, energy, and risk management.
The economy continued to grow, but at a slower pace. The labor market still looked more stable than weak, while the Fed remained cautious as inflation progress met a new energy-related complication.
Higher rates are no longer only a private-sector story. They are also putting increasing pressure on federal finances, even as trade-policy changes continue to create uncertainty for businesses.
For families, the new Trump Accounts are worth watching as a potential long-term savings tool, but the program is still in the rollout stage and some implementation details remain unsettled.
Market review
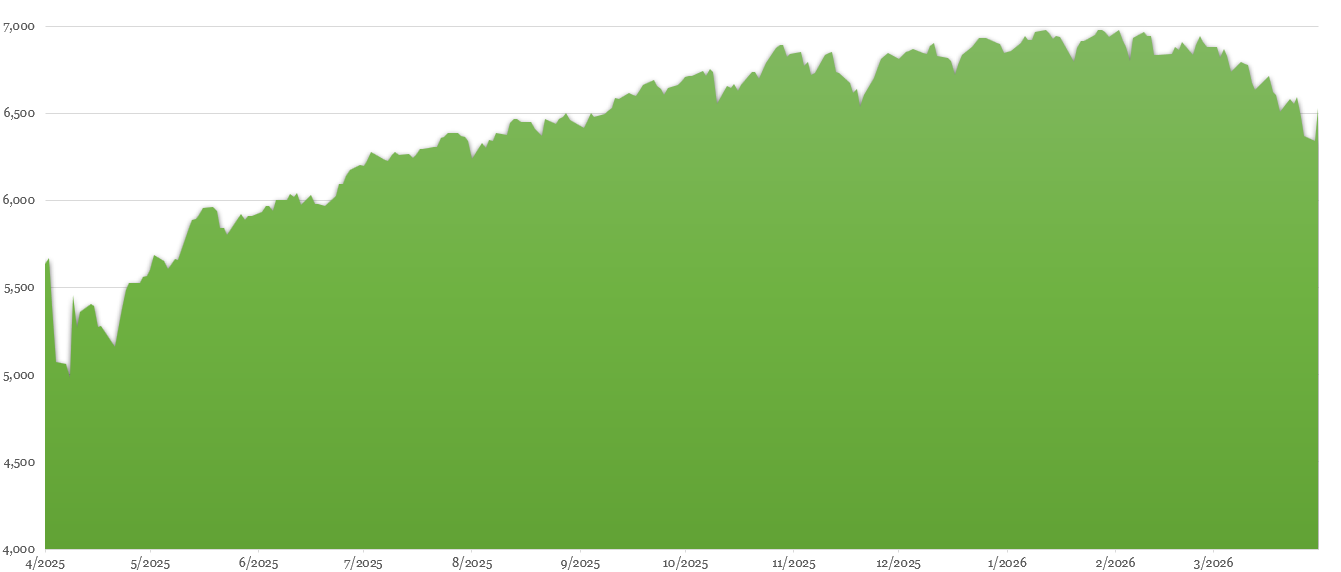
Markets entered 2026 with momentum, but Q1 ended on a much more cautious note. The U.S. market fell 3.96%, developed markets lost 0.94%, and emerging markets slipped 0.11% as late-quarter conflict in the Middle East shifted investor attention away from growth and AI enthusiasm and back toward inflation, energy prices, and risk management.[1]

Market Performance [Source: Quarterly Market Review – First Quarter 2026 by Dimensional Fund Advisors] [2]
Commodities were the standout performer this quarter, with the broad commodity index rising 24.4%[3]. Brent crude jumped 76% in first quarter after regional infrastructure damage and the effective closure of the Strait of Hormuz, a critical chokepoint for global energy trade. Geopolitics do not drive every quarter, but when they directly affect energy supply, the market impact can be both swift and far-reaching.
Beneath the surface, the market’s shift toward value continued in Q1[4], as investors showed more preference for companies generating solid earnings today and less willingness to pay up for earnings that may arrive further in the future. While the energy sector, which carries a heavy value weighting, was an important driver, other value-oriented areas also contributed, including financials such as banks and insurers that benefited from higher rates, as well as industrial and defense-related companies that gained from firmer commodity prices and rising geopolitical tensions. U.S. software stocks sold off sharply through late February as investors questioned whether newer AI capabilities could pressure traditional software-as-a-service business models and whether hyperscalers will ultimately earn attractive returns on their rising AI capital spending. More broadly, the quarter was a reminder that when market performance becomes narrow and expectations run high, even a small change in the narrative can lead to a meaningful repricing.
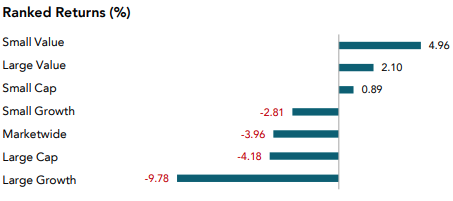
[Source: Quarterly Market Review – First Quarter 2026 by Dimensional Fund Advisors]
Bonds offered less protection than many investors had hoped. Higher energy prices revived inflation concerns, and the 10-year Treasury yield rose from 4.16% on December 31, 2025, to 4.31% on March 31, 2026, briefly reaching 4.44% on March 27 as markets backed away from the idea of near-term rate cuts[5]. In other words, both stocks and bonds were pressured by the same late-quarter inflation shock at the same time.
Private credit also came under greater scrutiny this quarter. Investors pulled billions from several large private credit funds, not because defaults had already surged, but because the risk-reward tradeoff had become less favorable. With spreads still tight and yields offering less cushion than in the past, investors grew more sensitive to liquidity risk if redemptions were to rise at the same time, as well as to the possibility that credit problems could become more visible if conditions deteriorate. Crypto markets struggled as well. Bitcoin briefly fell to about $63,000 in February—roughly half of its October 2025 peak before recovering somewhat in March, while ETFs still finished the quarter with net outflows[6]. Policy remained a swing factor too, after the U.S. passed its first major stablecoin law in 2025[7], debate in March over possible limits on stablecoin rewards added another layer of uncertainty.
Our long-term view remains constructive, and we continue to believe that patient, long-term investors are likely to be rewarded over time. At the same time, today’s market volatility and high valuations leave little room for complacency. In this kind of environment, discipline, diversification, and a willingness to look past recent winners matter as much as ever. The chart below helps illustrate that valuation backdrop. The Shiller CAPE ratio compares today’s market price to average inflation-adjusted earnings over the past 10 years, which makes it a useful way to view valuations in historical context. It is not a timing tool, but elevated CAPE readings have often been associated with lower long-term returns and a smaller margin for error. Today’s reading does not mean stocks cannot move higher from here, but it does suggest that future returns may depend more on earnings growth and less on further expansion in valuations.
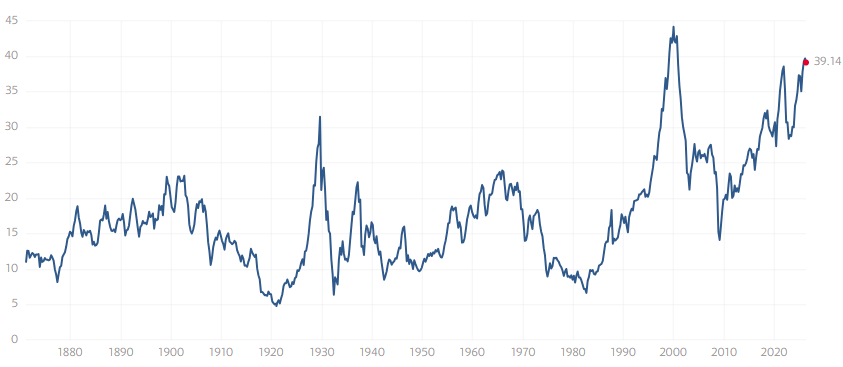
Shiller PE Ratio - Chart by: multpl [Source: https://www.multpl.com/shiller-pe]
Economy
The economy entered 2026 with less momentum than many investors had hoped. The second estimate showed real GDP grew at a 0.7% annualized rate in Q4[9], down sharply from 4.4% in Q3, and the Atlanta Fed’s GDPNow estimate for Q1 stood at 1.3%[9] on April 9. That still points to growth, but at a slower pace and with less room for new shocks than markets had been hoping for at the start of the year.
The labor market still looks more stable than weak. March payrolls rose 178,000 after a revised 133,000 decline in February, and the unemployment rate was 4.3%, down from 4.5% in November[10]. Looking through the month-to-month noise, total nonfarm payrolls rose about 22,000 jobs per month on average between March 2025 and March 2026, underscoring how much the labor market has cooled even if it has not yet clearly rolled over. With labor-force growth now much slower, mainly because the population is aging and immigration has eased, smaller payroll gains may increasingly be the new normal rather than a clear sign of labor-market weakness.
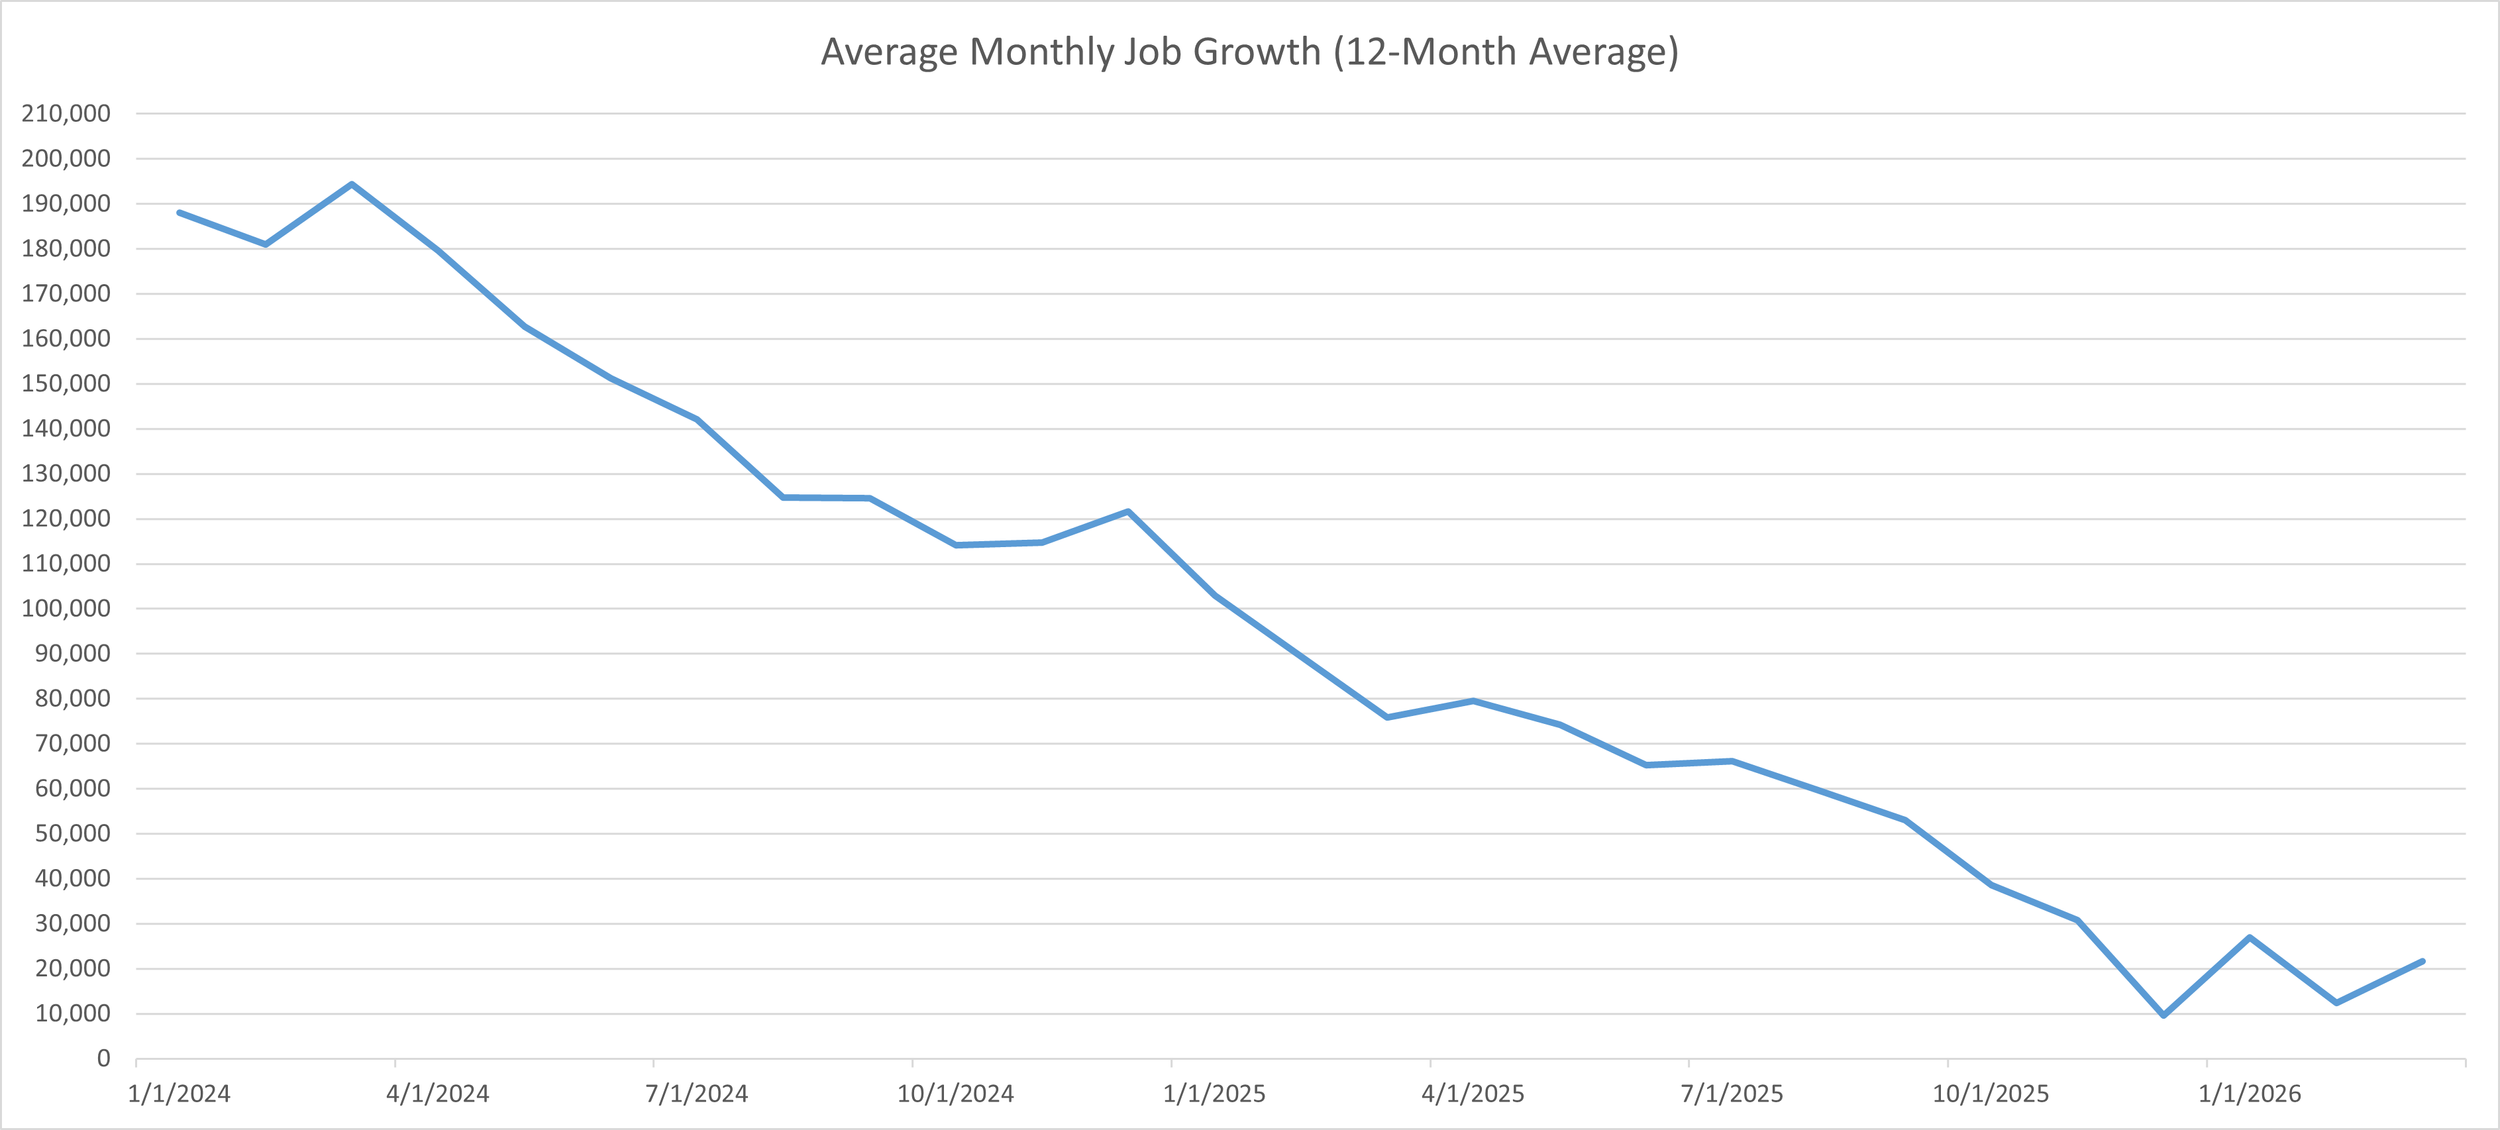
Total Nonfarm Payroll Change [Source: https://fred.stlouisfed.org/series/PAYEMS#]
Inflation had been moving in the right direction before the late-quarter energy shock, easing to 2.4% year over year in February[11]. March headline inflation then moved to 3.3%, while core inflation held at 2.6%, a reminder that even a temporary energy shock can complicate the disinflation story. [12].
While markets appear to be treating the Middle East energy shock as temporary, it is still something the Federal Reserve will need to consider. At its March meeting, the FOMC kept the federal funds target range at 3.50% to 3.75%, raised its median 2026 PCE inflation projection to 2.7% from 2.4% in December, and kept its median year-end policy-rate projection at 3.4%[13]. The takeaway is that “higher for longer” remains a real possibility, especially if higher energy prices begin to feed more clearly into inflation data in the months ahead. The recent oil spike also served as a reminder that the United States is not as insulated from global energy markets as domestic production numbers might suggest. The country remained a net crude oil importer in 2025[14], and crude oil still typically makes up around half of the retail price of gasoline, so higher oil prices are usually felt broadly by consumers and businesses even if some of the benefits accrue to domestic producers.
Higher interest rates are also putting pressure on the public sector, not just rate-sensitive private sectors like real estate. CBO says net interest costs totaled $970 billion in fiscal 2025, equal to roughly 54% of that year’s $1.8 trillion deficit[15]. As a share of GDP, net interest reached 3.2% in 2025, more than twice the level seen in 2021 and roughly back to the highs seen in the early 1990s[16]. This may not be the economy’s most immediate challenge, and it is more of a gradual pressure than an abrupt one, but it does mean the government is using a growing share of its budget simply to service existing debt. If that trend continues, it could reduce fiscal flexibility over time and make it harder to respond effectively to future downturns or other priorities.

Source: Federal Reserve Bank of St. Louis; U.S. Office of Management and Budget via FRED® [https://fred.stlouisfed.org/series/FYOIGDA188S#]
Recent ceasefire developments in the Middle East and the sharp reversal in oil prices suggest markets may be at least partly right in viewing this shock as temporary rather than the start of a more lasting inflation problem. While uncertainty remains, that is an encouraging sign for both the economic outlook and the path of inflation in the months ahead.
Trump Accounts: A New Savings Option for Families
You may have heard about the new “Trump Accounts,” a savings vehicle created to help give children an early financial start. These accounts are currently scheduled to begin accepting contributions on July 4, 2026, and Treasury and the IRS are still issuing guidance, so some operational details may continue to evolve. Even so, the basic structure and tax treatment are becoming clearer.
The biggest headline is the U.S. Treasury’s planned $1,000 contribution for eligible U.S.-citizen children born between January 1, 2025, and December 31, 2028, assuming the required election is made. More broadly, children under age 18 with a valid Social Security number may have a Trump Account opened for them. The child is the account beneficiary, while a parent, guardian, or other authorized individual serves as the responsible party managing the account until the child reaches adulthood.
From a planning standpoint, the simplest way to think about these accounts is as an IRA-style vehicle for children, with some important special rules during the early years. Contributions from family members and others are currently capped at $5,000 per year in the aggregate, and certain employer contributions may also be allowed under separate rules. Unlike traditional IRA contributions, family contributions to Trump Accounts are not tax-deductible.
One important distinction is timing. In general, funds cannot be withdrawn before January 1 of the year the child turns 18. After that growth period, the account generally is treated as a traditional IRA, which means distributions are generally taxable and early-withdrawal penalties may apply unless an exception is available. Because the program is still being implemented, some practical details may change as final regulations are issued.
If you have questions about whether a Trump Account could be useful for your family, or how it might fit alongside other savings vehicles such as 529 plans, custodial accounts, or retirement accounts, please reach out. We would be happy to discuss how it may complement your broader long-term financial plan.
Authors:Richard Toth, CFA, CAIA; Noah Hoekstra, CFP
References
[1] Source: Quarterly Market Review – First Quarter 2026 by Dimensional Fund Advisors
[2] US Stock Market (Russell 3000 Index), International Developed Stocks (MSCI World ex USA Index [net dividends]), Emerging Markets (MSCI Emerging Markets Index [net dividends]),Global Real Estate (S&P Global REIT Index [net dividends]), Commodities (The Bloomberg Commodity Total Return Index), US Bond Market (Bloomberg US Aggregate Bond Index), Global Bond Market ex US (Bloomberg Global Aggregate ex-USD Bond Index [hedged to USD]), Crypto (S&P Cryptocurrency Broad Digital Asset Index)
[3-4] Source: Quarterly Market Review – First Quarter 2026 by Dimensional Fund Advisors
[5] Source: https://www.cnbc.com/quotes/US10Y
[6] Source: https://www.coindesk.com/markets/2026/04/01/bitcoin-etfs-post-first-inflows-since-october-as-price-stabilizes?utm_source=chatgpt.com
[7] Source: https://perkinscoie.com/insights/update/stablecoin-interest-yield-and-rewards-occ-proposes-sweeping-regulations-under?utm_source=chatgpt.com
[8] Source: U.S. Bureau of Economic Analysis
[9] Federal Reserve Bank of Atlanta’s GDPNow as of April 9, 2026
[10-12] Source: U.S. Bureau of Labor Statistics
[13] Source: Board of Governors of the Federal Reserve System [https://www.federalreserve.gov/monetarypolicy/openmarket.htm]
[14] Source: https://www.eia.gov/energyexplained/us-energy-facts/data-and-statistics.php
[15] Source: https://www.cbo.gov/publication/62286
[16] Source: Federal Reserve Economic Data - Federal Outlays: Interest as Percent of Gross Domestic Product [https://fred.stlouisfed.org/series/FYOIGDA188S]
Disclosures
VanderPol Investments, LLC (“VPI”) is a registered investment adviser located in Michigan. VPI may only transact business in those states in which it is registered, or qualifies for an exemption or exclusion from registration requirements.
This presentation is limited to the dissemination of general information regarding VPI’s investment advisory services. Accordingly, the information in this presentation should not be construed, in any manner whatsoever, as a substitute for personalized individual advice from VPI. Information presented is for educational purposes only and does not intend to make an offer or solicitation for the sale or purchase of any specific securities, investments, or investment strategies. Investments involve risk and unless otherwise stated, are not guaranteed. Be sure to first consult with a qualified financial adviser and/or tax professional before implementing any strategy discussed herein. Any client examples were hypothetical and used to demonstrate a concept.
Past performance is not indicative of future performance. Therefore, no current or prospective client should assume that future performance of any specific investment, investment strategy (including the investments and/or investment strategies recommended by VPI), or product referenced directly or indirectly in this presentation, will be profitable. Different types of investments involve varying degrees of risk, & there can be no assurance that any specific investment or investment strategy will suitable for a client’s or prospective client’s investment portfolio.
Various indexes were chosen that are generally recognized as indicators or representation of the stock market in general. Indices are typically not available for direct investment, are unmanaged and do not include fees or expenses. Some indices may also not reflect reinvestment of dividends.
VPI may discuss and display, charts, graphs, formulas which are not intended to be used by themselves to determine which securities to buy or sell, or when to buy or sell them. Such charts and graphs offer limited information and should not be used on their own to make investment decisions.
