
Key Takeaways
Global markets extended gains despite a volatile first half of the year.
International stocks outpaced U.S. stocks, helped by a weaker U.S. dollar.
Communication Services and Technology led U.S. sector returns, while Real Estate lagged.
Commodities had a strong finish to the year; precious metals were standout performers.
Bonds delivered steady returns as yields ended the year lower and the curve stayed inverted.
The economy rebounded after a weak Q1, and GDP tracking for Q4 shifted sharply as trade data came in.
Market review
2025 marked the third consecutive year of double-digit growth for global markets, a remarkable feat given the high volatility, particularly in the first half of the year. Despite early turbulence, markets steadily added gains, rewarding long-term investors who stayed the course. In last quarter of the year, US stocks gained 2.4%, lagging International Developed stocks at 5.2% and Emerging Market stocks at 4.7%[1].
For full 2025, U.S. equities delivered strong performance once again, though international stocks outpaced them by a wide margin. That was driven not only by a bullish sentiment about future growth abroad but also by a meaningful currency tailwind. The U.S. dollar posted its worst firs half of the year since 1970[2], losing 10%[3] in full 2025, enhancing returns for U.S.-based investors holding international assets.

Market Performance [Source: Quarterly Market Review – Fourth Quarter 2025 by Dimensional Fund Advisors] [4]
Within the U.S., the top-performing sector in 2025 was Communication Services with 34% aided by Alphabet’s 65% return[6], followed closely by Technology. However, the ride was far from smooth and at one point, the tech sector declined more than 20% before recovering. Real Estate was the weakest sector with 4% return for the year, still pressured by the effects of higher interest rates. Overall, the wide range of outcomes across sectors reinforced the importance of diversification and discipline.
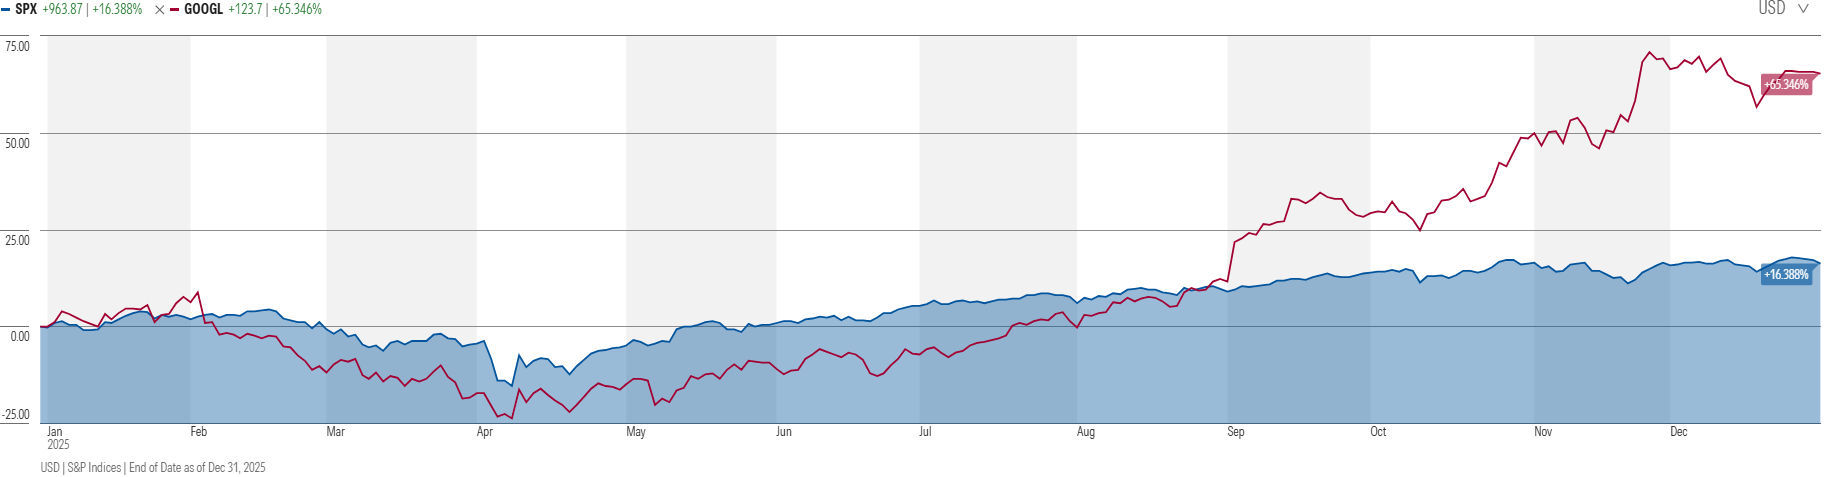
S&P 500 vs GOOGL price return [Source: Morningstar Direct Advisory Suite]
AI remained a dominant market theme, driving both innovation and investor enthusiasm. Despite headwinds such as trade tariffs, companies proved resilient, with corporate earnings growing an estimated 12% in 2025, following 11% growth in 2024 according to FactSet[7]. However, stock prices rose faster than earnings, pushing valuations further into historically stretched territory. For example, Vanguard Capital Markets Model® forecasts just a 3.5% to 5.5%[8] return for U.S. equities over the next decade. As a result, we remain cautiously optimistic and suggest a small (around 5%) additional allocation to bonds as a margin of safety.
While our equity allocations slightly lagged the MSCI All Country World Index due to our greater emphasis on U.S. markets, our allocation to international stocks still contributed positively. As noted, currency effects played a substantial role in 2025, reinforcing the value of maintaining a global perspective in portfolio construction.
Commodities were the best-performing asset class last quarter, rising 5.8%, and they built on that momentum with a strong full-year gain of 15% in 2025[9]. Precious metals led the way as silver surged in the second half of the year and posted a remarkable 65% gain in Q4 alone[10], helping it catch up to gold after lagging earlier in the year. Performance across commodity sectors was not uniform, however. Most areas were positive, while the only subsector to finish the year in negative territory was soft agricultural commodities such as sugar and cotton.
Crypto assets faced a challenging year, declining -26% in Q4 and finishing 2025 down -15% overall[11]. Still, the year was far from a setback for the crypto ecosystem: key legislative milestones improved regulatory clarity and strengthened the case for crypto’s potential role in everyday finance. In line with that evolution, we added Solana to our existing cryptocurrency holdings of Bitcoin and Ethereum. Solana provides exposure to a high-speed, low-cost network designed for decentralized applications and smart contracts, complementing Bitcoin’s store-of-value role and Ethereum’s platform capabilities.
Bond markets delivered steady performance, with U.S. bonds gaining 1.1% in Q4 and finishing the year up 7.3%[12]. While rates were volatile early in the year, yields ended 2025 lower overall. The yield curve remained inverted heading into 2026 (short-term rates still higher than long-term rates), and the spread between government and corporate bonds stayed near historical lows[13] reflecting investor confidence and a continued willingness to take credit risk.
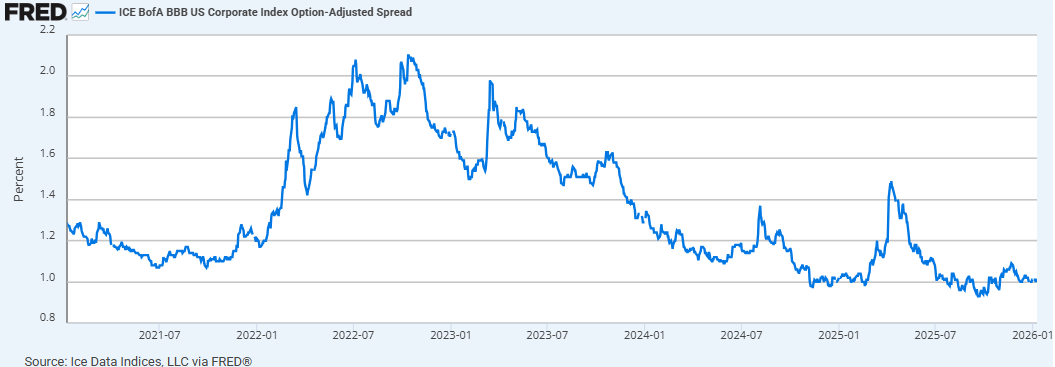
Chart by Federal Reserve Economic Data
Economy
The U.S. economy performed well in 2025, and Q4 growth is tracking in a healthy range despite meaningful headwinds. After a rough start when real GDP declined at a -0.5% annual rate in Q1, the activity rebounded with strong mid-year momentum, including 3.8% in Q2 and 4.3% in Q3[14]. The Atlanta Fed’s GDPNow model is indicating 5.1% for Q4[15], up from 2.7% just a couple of days earlier. This highlights how quickly tracking estimates can move as new data arrives, with the biggest change coming from trade where the model’s contribution of net exports to Q4 growth increased from -0.30% to 1.97%[16].
Government demand and parts of business investment (notably AI- and data-center-related spending) also contributed to resilience. At the same time, growth faced offsets from trade and policy uncertainty, interest-rate-sensitive areas, and uneven business investment outside the strongest themes. That unevenness also showed up in the labor market: by occupation and industry, softer pockets included service occupations (5.0% unemployment), or sales/office occupation at 4.4% (jump from only 3.6% a year ago)[17]. Several states continued to lag as well, most notably D.C. (6.5%), California (5.5%), or Michigan (5.0%)[18].
Inflation stayed below 3% late in 2025, even with tariff concerns. The BLS reported CPI up 2.7% year-over-year in November 2025, with core CPI up 2.6%[19]. A meaningful part of the moderation has been cooling in housing-related inflation: the CPI shelter index was up 3.0%[20] over the last year (still positive, but clearly below prior peaks), helping offset modest firming in some goods categories. This cooling also aligns with what many households experienced in the real estate market, activity improved at the margins as financing conditions stabilized, but affordability and rate sensitivity remained constraints.
The labor market continued to soften, with unemployment rising from 4.0% in January to 4.6% by November, to end the year at 4.4% in December 2025[21]. The combination of cooler inflation and a gradually weaker labor picture gave the Fed room to ease again in Q4. It cut rates two times (Oct and Dec), bringing the target range to 3.50%–3.75%[22]. For 2026, market pricing generally points to some additional easing, though policymakers’ projections appear more cautious than futures pricing at this time.
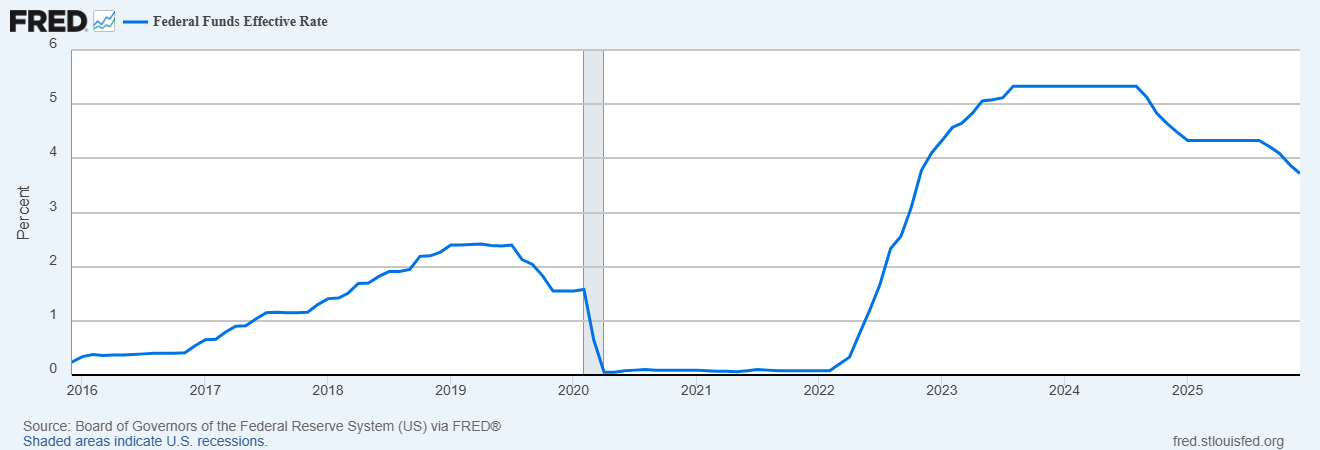
Chart by Federal Reserve Economic Data
As seen in the Fed’s industrial production index chart below, U.S. industrial output has been on a remarkably slow path for more than two decades, it was roughly 93 in mid-2000 and only about 102.4 by December 2007, before effectively stalling again, with November 2025 still around 101.8[23]. That long period of sluggish capacity growth helps explain why rebuilding domestic manufacturing has become such a priority: when U.S. production doesn’t expand enough to meet demand, the shortfall is often met through imports, which can keep the trade deficit structurally elevated. Consistent with that backdrop, the annual goods-and-services balance widened from about -$256B (1999) to -$370B (2000), then to roughly -$711B (2007), and most recently -$904B (2024)[24].In 2025, frequent tariff changes created unusually noisy monthly trade prints, driven by front-loading, shipping delays, and shifting sourcing patterns, so it is still too early to draw firm conclusions. That said, we are starting to see early signs of improvement in the smoothed data: the three-month moving average trade deficit narrowed to $44.4B for the three months ending October, alongside October’s unusually low -$29.4B monthly deficit[25] while the Industrial Production Index improve to 101.79 in November from 99.2 a year ago in November 2024.
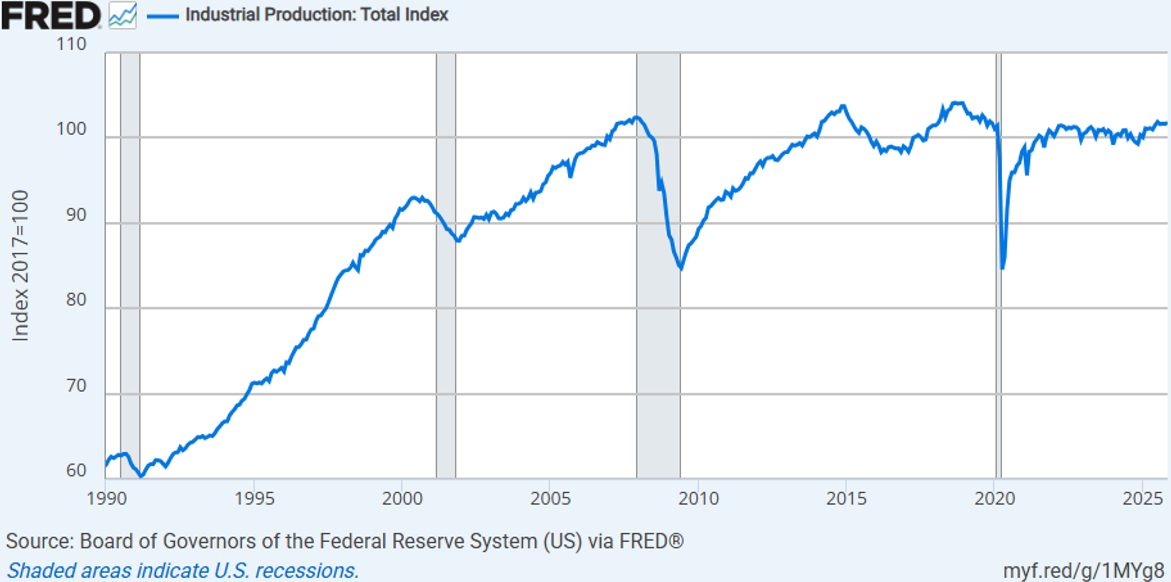
Chart by Federal Reserve Economic Data
ACA Health Insurance Changes & Planning Opportunities
For clients buying health insurance through the ACA Marketplace, tax planning can make a big difference because your subsidy is tied to household income (modified AGI) as a % of the Federal Poverty Level. For tax years 2021–2025, Congress temporarily removed the old 400% of FPL cutoff, but without an extension the rules can revert, meaning households near that threshold could see a sharp change in subsidy and a much higher net premium in 2026. The most severe increases can hit families just over the 400%-of-FPL threshold, and in many cases the impact can be reduced with careful planning to manage AGI.
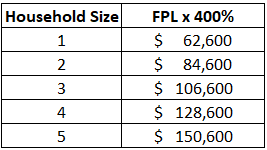
If you’re on a Marketplace plan and think your household income may land near the 400% column for your household size, please meet with us as there are often practical ways to smooth or reduce reportable income so you don’t accidentally cross a key subsidy threshold.
Authors: Mark VanderPol, CFA, CFP; Richard Toth, CFA, CAIA; Noah Hoekstra, CFP
References
[1] Source: Quarterly Market Review – Fourth Quarter 2025 by Dimensional Fund Advisors
[2] Source: Reuters [https://www.reuters.com/data/dollar-dominance-tracker-2025-10-01/]
[3] Based on U.S. Dollar Index (DXY) [source: https://www.wsj.com/market-data/quotes/index/DXY/advanced-chart]
[4] US Stock Market (Russell 3000 Index), International Developed Stocks (MSCI World ex USA Index [net dividends]), Emerging Markets (MSCI Emerging Markets Index [net dividends]),Global Real Estate (S&P Global REIT Index [net dividends]), Commodities (The Bloomberg Commodity Total Return Index), US Bond Market (Bloomberg US Aggregate Bond Index), Global Bond Market ex US (Bloomberg Global Aggregate ex-USD Bond Index [hedged to USD]), Crypto (S&P Cryptocurrency Broad Digital Asset Index)
[6] Source: Morningstar [https://www.morningstar.com/markets/which-stocks-drove-markets-gains-2025]
[7] FactSet Research Systems Inc - Earnings Insight December 19, 2025 [https://advantage.factset.com/hubfs/Website/Resources%20Section/Research%20Desk/Earnings%20Insight/EarningsInsight_121925.pdf]
[8] Source: Vanguard - Vanguard Capital Markets Model® forecasts as of December 10, 2025 []
[9 - 10] Source: Quarterly Market Review – Fourth Quarter 2025 by Dimensional Fund Advisors
[11] S&P Cryptocurrency Broad Digital Asset Index
[12] Source: Quarterly Market Review – Fourth Quarter 2025 by Dimensional Fund Advisors
[13] Source: Quarterly Chartbook Q1 2026 by Charles Schwab Investment Management, Inc.
[14] Source: U.S. Bureau of Economic Analysis
[15] Federal Reserve Bank of Atlanta’s GDPNow as of January 9, 2026
[16] Federal Reserve Bank of Atlanta’s GDPNow as of January 8, 2026
[17] Source: U.S. Bureau of Labor Statistics - Labor Force Statistics from the Current Population Survey as of January 09, 2026 [https://www.bls.gov/web/empsit/cpseea30.htm]
[18] Source: U.S. Bureau of Labor Statistics - State unemployment rates (LAUS - November 2025, seasonally adjusted) [https://www.bls.gov/web/laus/laumstrk.htm]
[19 - 20] Source: U.S. Bureau of Economic Analysis
[21] Source: U.S. Bureau of Labor Statistics
[22] Source: Board of Governors of the Federal Reserve System [https://www.federalreserve.gov/monetarypolicy/openmarket.htm]
[23] Source: Federal Reserve Economic Data - Industrial Production: Total Index [https://fredblog.stlouisfed.org/2025/12/us-industrial-production/]
[24] Source: Federal Reserve Economic Data [https://fred.stlouisfed.org/series/IEABCGSA#]
[25] Source: U.S. Bureau of Economic Analysis - U.S. International Trade in Goods and Services October 2025
Disclosures
VanderPol Investments, LLC (“VPI”) is a registered investment adviser located in Michigan. VPI may only transact business in those states in which it is registered, or qualifies for an exemption or exclusion from registration requirements.
This presentation is limited to the dissemination of general information regarding VPI’s investment advisory services. Accordingly, the information in this presentation should not be construed, in any manner whatsoever, as a substitute for personalized individual advice from VPI. Information presented is for educational purposes only and does not intend to make an offer or solicitation for the sale or purchase of any specific securities, investments, or investment strategies. Investments involve risk and unless otherwise stated, are not guaranteed. Be sure to first consult with a qualified financial adviser and/or tax professional before implementing any strategy discussed herein. Any client examples were hypothetical and used to demonstrate a concept.
Past performance is not indicative of future performance. Therefore, no current or prospective client should assume that future performance of any specific investment, investment strategy (including the investments and/or investment strategies recommended by VPI), or product referenced directly or indirectly in this presentation, will be profitable. Different types of investments involve varying degrees of risk, & there can be no assurance that any specific investment or investment strategy will suitable for a client’s or prospective client’s investment portfolio.
Various indexes were chosen that are generally recognized as indicators or representation of the stock market in general. Indices are typically not available for direct investment, are unmanaged and do not include fees or expenses. Some indices may also not reflect reinvestment of dividends.
VPI may discuss and display, charts, graphs, formulas which are not intended to be used by themselves to determine which securities to buy or sell, or when to buy or sell them. Such charts and graphs offer limited information and should not be used on their own to make investment decisions.
