
Key Takeaways
MATCH Planning shows how matching the right assets to the right heirs may increase after-tax value and reduce family friction.
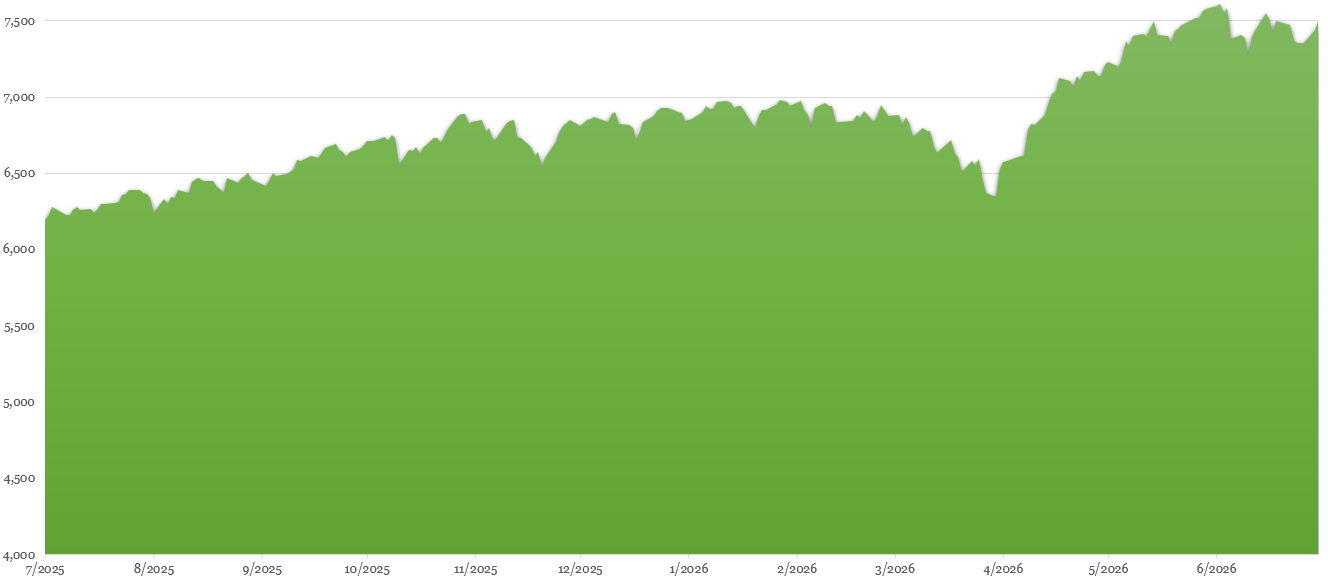
Markets rebounded strongly in the second quarter as energy concerns eased and investors refocused on AI, earnings, and growth.
U.S. stocks reached new all-time highs, while emerging markets were especially strong due to large exposure to semiconductors and technology hardware.
Commodities gave back part of their first quarter gains as oil prices declined following de-escalation in the Middle East.
Bonds delivered modest positive returns, but inflation and Fed policy uncertainty continued to limit upside.
The economy is still growing, but at a slower pace, with recent labor market data showing some cooling.
AI-related capital spending remains an important economic tailwind, but it could become a vulnerability if investment slows or expected returns are questioned.
MATCH Planning Case Study: How the Same Estate, After Taxes, Can Be Optimized to be Worth More
Before looking at the numbers, it helps to define one important tax concept: marginal ordinary income tax rate. A person’s marginal ordinary income tax rate is the tax rate they pay on their next dollar of ordinary income. Ordinary income generally includes wages, IRA distributions, business income, interest income, and similar income. It does not mean every dollar they earn is taxed at that rate. Instead, it reflects the tax cost of receiving additional taxable income. This matters in estate planning because different assets can have very different after-tax values depending on who receives them. A traditional IRA may be worth less to a high-income heir because future distributions are generally taxed as ordinary income. A Roth IRA may be especially valuable to a high-income heir because qualified distributions can be tax-free. A home may have a different tax profile altogether. In other words, three heirs can inherit the same dollar amount on paper, but not receive the same value after taxes.
The Family
Mary, Ben, and Karen are three adult children set to inherit from their parents. Mary is a public school teacher with moderate income and a 12% marginal ordinary income tax rate. Because she is in a lower tax bracket, taxable IRA distributions are less costly to her than they would be to her siblings. Ben is a mid-career engineering manager with a 22% marginal ordinary income tax rate. He lives near the family home and has expressed the strongest interest in keeping it in the family. Karen is a successful physician in her peak earning years and has a 37% marginal ordinary income tax rate. Because of her higher income, additional IRA distributions are especially costly to her, while Roth IRA assets are especially valuable.
The estate has three major assets:

At first glance, splitting everything equally may seem fair. Each child receives one-third of each asset. But from an after-tax perspective, the result may not be equal at all.
Step 1: View Each Asset Through Each Child’s Tax Situation
The same asset has a different after-tax value depending on which child receives it.

For this simplified example, we assume the traditional IRA is reduced by each child’s tax burden, while the Retirement accounts receives a tax-free compounding benefit that is more valuable to higher-tax heirs.

This table is the key to the strategy.
The IRA is most valuable in Mary’s hands because she has the lowest marginal ordinary income tax rate. The Roth IRA is most valuable in Karen’s hands because the tax-free nature of the Roth is most valuable to the highest-tax heir. The home has the same assumed tax-aware value for all three, but Ben is the child who actually wants to keep and maintain it.
Scenario 1: Equal Split
Under a traditional equal split, each child receives one-third of each asset.

That creates the following after-tax values:


The equal split looks fair on paper because everyone receives one-third of each asset. But after taxes and asset characteristics are considered, Mary receives an estimated tax-aware value of $493,333, Ben receives $486,667, and Karen receives $471,667.
The family also still has to deal with the home. Does Ben buy out Mary and Karen? Is the house sold? Who chooses the value? What happens if one heir wants cash and another wants the property?
Those questions can become sources of family friction after death.
Scenario 2: MATCH Planning
MATCH stands for: Multi-Asset Tax-Coordinated Heirship
Instead of splitting every asset equally, the estate is coordinated in advance so that each heir receives the assets that best fit their tax situation, personal circumstances, and family preferences.
In this example, the plan intentionally allocates:

Mary receives the traditional IRA because she is in the lowest tax bracket. Ben receives the home because he is the heir most interested in owning it. Karen receives most of the Roth IRA because tax-free Roth assets are most valuable to her as the highest-income heir.
The result is shown below:


The MATCH Planning result is not only more tax-efficient; it is also easier to understand from each heirs’ perspective.
Mary receives a tax-aware value of approximately $502,432. Ben receives approximately $502,568. Karen receives approximately $502,480. Each child ends up with a similar tax-aware result, but the family gets there by matching the assets more intentionally.
The Value Add

In this simplified case study, coordinating which heir receives which asset increases the aggregate after-tax value of the estate by approximately $55,813.
Just as importantly, the MATCH strategy can significantly reduce the potential for family conflict. Rather than leaving beneficiaries to negotiate who receives the residence, retirement accounts, or other unique assets, and how to fairly equalize the estate after death, the allocation framework is established in advance. This may be accomplished collaboratively during the grantor's lifetime with the guidance of professional advisors, or after death by granting the Trustee discretionary authority to allocate assets in a manner consistent with the grantor's objectives. The trust may also include an illustrative allocation schedule demonstrating the grantor's preferred optimization approach, providing the Trustee with practical guidance while preserving the flexibility needed to address changes in asset values, tax laws, and family circumstances.
Why This Matters
Many estate plans focus on equal shares. Equal shares are simple, but they are not always optimal.
Families do not inherit tax rates equally. They do not inherit preferences equally. They do not inherit life circumstances equally.
One child may be in a lower tax bracket and be better suited to receive taxable IRA assets. Another child may be in a higher tax bracket and benefit more from Roth IRA assets. Another child may live nearby and be the natural person to receive the family home.
MATCH Planning helps coordinate these decisions before death, using a tax-aware framework that considers real estate, traditional IRAs, Roth IRAs, taxable accounts, beneficiary designations, family preferences, and the practical realities of administering an estate. This provides an intelligent and easily administered result that produces family peace and creates value.
Professional Coordination Is Essential
To achieve these results, it is imperative to work with a team of professionals who can keep the trust, account titling, and beneficiary designations up to date. Estate plans can become outdated as tax laws change, assets change, family circumstances change, and account values move over time.
A plan like this may involve a financial advisor, estate planning attorney, CPA, trustee, and the proper technology to model different inheritance outcomes. Without that coordination, even a well-intentioned estate plan can create unintended tax consequences or family conflict.
At VanderPol Investments, we are beginning to put these plans in place using the MATCH Planning framework and Celestial Divide technology. Our goal is to help families coordinate their estate plans in a way that is tax-aware, practical, and designed to reduce conflict before it starts.
If you are interested in learning more and would like to schedule a meeting, please contact us for more information.
Market review
The second quarter brought another eventful period for investors. Daily developments in the Middle East continued to keep markets on edge, SpaceX successfully completed a record-setting IPO, and Kevin Warsh chaired his first Federal Reserve meeting after taking over from Jerome Powell. Despite some negative headlines, markets stabilized during the quarter and gradually shifted their focus away from energy supply concerns and back toward artificial intelligence, corporate earnings, and the broader growth outlook.
The result was a very strong quarter for most major asset classes. U.S. stocks rose roughly 15%, developed international markets also gained solidly, and emerging markets surged about 24%, their best quarterly return since 2009. Real estate also posted a strong quarter, while bonds delivered modest positive returns. Commodities were the major exception, falling roughly 8% as oil prices declined and the Middle East energy shock began to ease.

Market Performance [Source: Quarterly Market Review – Second Quarter 2026 by Dimensional Fund Advisors] [1]
The commodity reversal was especially notable given how important energy had been in the first quarter. Oil prices fell sharply as the conflict with Iran de-escalated from active war to more limited skirmishes, and markets began to anticipate a gradual reopening of the Strait of Hormuz. While energy flows have not fully returned to pre-war levels, the market has been able to cope for now through a combination of strategic reserves, available spare production capacity, and some adjustment in demand. That helped reduce fears of a more prolonged energy supply disruption, although the quarter was also a reminder that global energy markets remain highly complex and can change quickly when geopolitics are involved.
Strong stock market returns were not only about lower oil prices. They were also supported by better earnings expectations and a clear rotation back into artificial intelligence and the infrastructure needed to support it. Semiconductor stocks were the most visible example, with the PHLX Semiconductor Index up 88% during the quarter[2]. As the chart shows, earnings growth expectations have increasingly shifted in favor of U.S. semiconductor companies, even as growth for the large U.S. hyperscalers has begun to slow from earlier elevated levels. That helps explain why individual AI infrastructure beneficiaries were even stronger, including Micron, which rose more than 241% as demand for memory chips surged, and Marvell Technology, which gained about 200% as investors rewarded networking and custom silicon exposure[3]. However, the AI buildout is not limited to traditional technology companies. Data centers require enormous amounts of power, cooling, construction, and electrical infrastructure, which has benefited companies outside the semiconductor sector as well. Caterpillar is one example. Its power generation equipment sales are expected to triple by 2030 from 2024 levels, and its order backlog reached $62.7 billion at the end of the first quarter[4], rewarding the stock by 86% gain year-to-date[5].
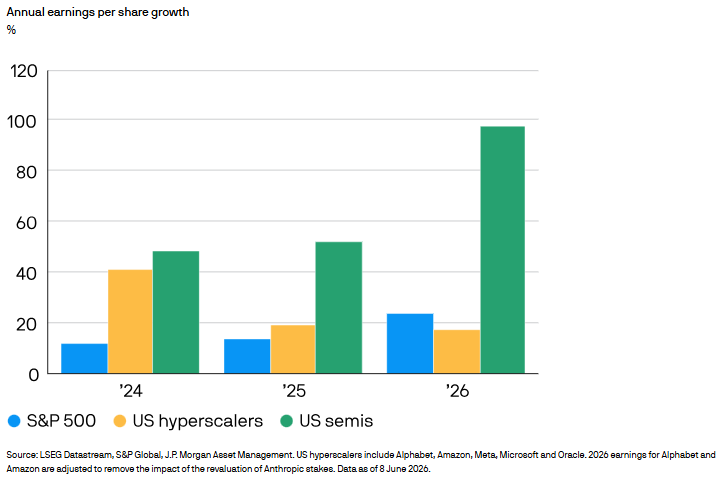
Chart by: J.P.Morgan Asset Management [Source: https://am.jpmorgan.com/wr/en/asset-management/institutional/insights/market-insights/investment-outlook/technology-and-ai]
Even in strong markets, we believe discipline still matters. Over time, short-term valuation swings tend to smooth out, but where investors choose to allocate can still make a meaningful difference. Our preferred approach does not simply buy the largest companies in proportion to their market size. Instead, managers such as Avantis use a systematic, evidence-based process that seeks broad diversification while modestly emphasizing companies with characteristics historically associated with higher expected returns, including attractive valuations, stronger profitability, and smaller company size. We believe this provides a thoughtful balance between active management and efficient implementation, allowing portfolios to stay disciplined, keep turnover and costs low, and maintain consistent exposure to the long-term drivers of return we want for client portfolios.
Bonds had a quieter quarter, with the U.S. bond market posting a modest gain at 0.67%[6]. Interest rates remained sensitive to inflation data, Fed policy expectations, and the changing growth outlook. With inflation still above the Federal Reserve’s target, bonds continue to face a more complicated environment than they would in a normal easing cycle. Still, bonds remain an important part of diversified portfolios, especially for clients who need stability, income, and lower overall portfolio volatility.
Economy
The economy continues to grow, but the pace has slowed compared with the stronger periods of the post-pandemic expansion. The latest third estimate showed real GDP grew at a 2.1% annualized rate in the first quarter, up from 0.5% in the fourth quarter of 2025[7]. Michigan lagged the national average with real GDP growth at 0.4% in Q1[8]. The Atlanta Fed’s GDPNow estimate for the second quarter was 1.3% as of July 8[9], suggesting growth remained positive but more modest.
The labor market remains stable, but the most recent data show some cooling as the June report showed only 57,000 jobs added[10], with April and May revised lower. The unemployment rate moved down to 4.2%[11], although that decline was helped by a drop in labor force participation rather than a clear acceleration in hiring.
Inflation remains the biggest challenge. The May CPI report showed consumer prices up 0.5% for the month and 4.2% over the prior year, with energy prices still a major driver[12]. Core CPI, which excludes food and energy, rose 2.9% year over year[13]. The Fed’s preferred inflation measure also remains above target, with the May PCE price index up 4.1% from a year earlier and core PCE up 3.4%[14].
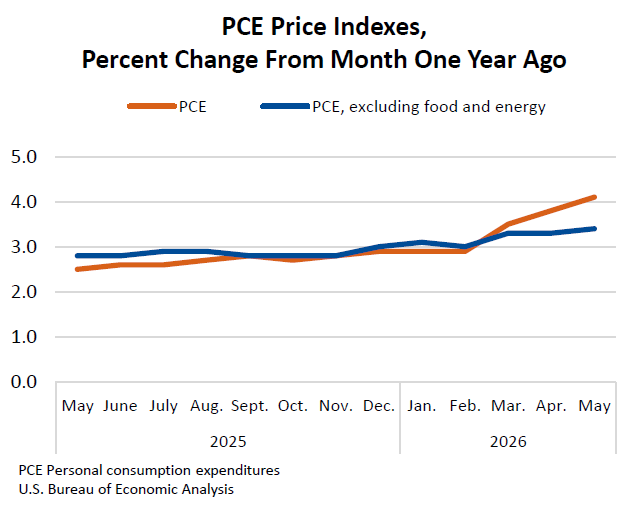
Source: U.S. Bureau of Economic Analysis [https://www.bea.gov/news/2026/personal-income-and-outlays-may-2026]
Consumers are still spending, but household finances look more fragile than they did earlier in the cycle. In May, personal consumption expenditures rose 0.7% in current dollars, while the personal saving rate was only 3.0%, well below the 6–8% range that was more typical before the pandemic and even lower than levels seen in the early stages of the recovery[15]. Real wage growth has also been pressured by inflation, with real average hourly earnings down 0.7% from May 2025 to May 2026[16], down compared to -0.3% in April and +0.% in March.
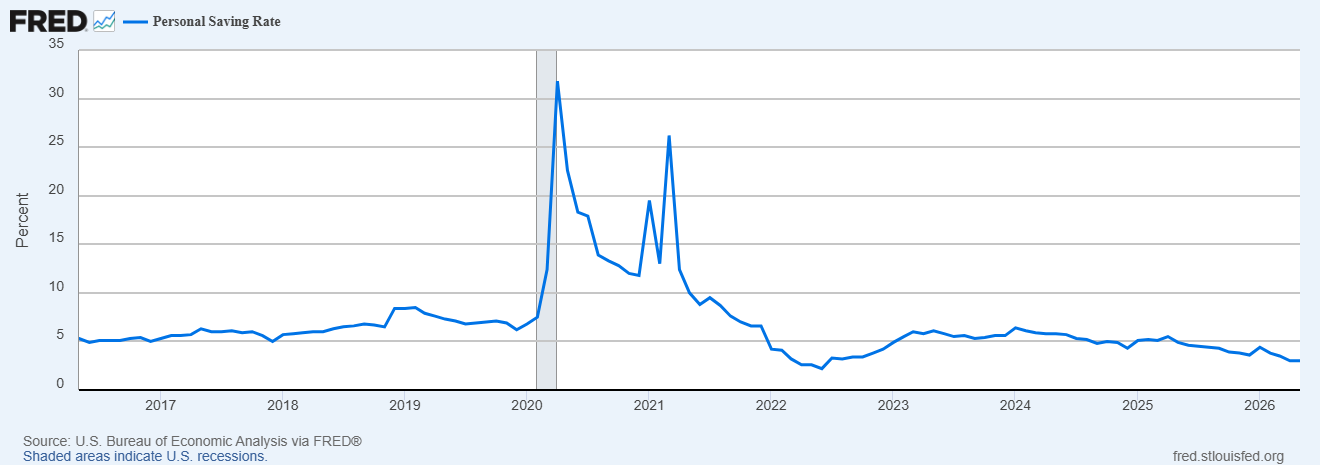
Personal saving is equal to personal income less personal outlays and personal taxes [Source: U.S. Bureau of Economic Analysis via FRED®]
The Federal Reserve responded to this mixed environment by leaving rates unchanged at its June meeting, the first chaired by newly appointed Kevin Warsh, maintaining the federal funds target range at 3.50% to 3.75%[17]. That decision reflects the tension in the data. Growth is slower, the labor market is cooling, and consumers are under pressure, but inflation is still too high for the Fed to declare victory.
AI-related capital spending remains one of the most important supports for the economy in 2026. Capital spending by five major U.S. hyperscalers is now expected to be near $700 billion this year[18], up from roughly $160 billion in 2022[19] before the AI infrastructure boom accelerated. That implies an increase of about half a trillion dollars in annual capital spending, equal to roughly 2% of U.S. GDP and more than 10% of total U.S. private nonresidential fixed investment. This surge is rippling through the broader economy, driving demand for semiconductors, networking equipment, power infrastructure, construction, and related services. While it provides a meaningful near-term boost to growth, it also introduces a key vulnerability: if the pace of AI investment slows or confidence in its returns fades, one of the economy’s primary growth engines could weaken.
Authors: Mark VanderPol, CFA, CFP; Richard Toth, CFA, CAIA
References
[1] US Stock Market (Russell 3000 Index), International Developed Stocks (MSCI World ex USA Index [net dividends]), Emerging Markets (MSCI Emerging Markets Index [net dividends]),Global Real Estate (S&P Global REIT Index [net dividends]), Commodities (The Bloomberg Commodity Total Return Index), US Bond Market (Bloomberg US Aggregate Bond Index), Global Bond Market ex US (Bloomberg Global Aggregate ex-USD Bond Index [hedged to USD]), Crypto (S&P Cryptocurrency Broad Digital Asset Index [Source: https://www.spglobal.com/spdji/en/indices/digital-assets/sp-cryptocurrency-broad-digital-asset-bda-index/#overview])
[2] Source: Nasdaq, Inc. via FRED® [https://fred.stlouisfed.org/series/NASDAQSOX#]
[3] Source: Google Finance [MU:NASDAQ; MRVL:NASDAQ]
[4] Source: Reuters [https://www.reuters.com/business/caterpillars-first-quarter-profit-rises-robust-construction-power-equipment-2026-04-30/]
[5] Source: Google Finance [CAT:NYSE]
[6] Source: Quarterly Market Review – Second Quarter 2026 by Dimensional Fund Advisors
[7-8] Source: U.S. Bureau of Economic Analysis
[9] Federal Reserve Bank of Atlanta’s GDPNow as of July 8, 2026
[10-13] Source: U.S. Bureau of Labor Statistics
[14-15] Source: U.S. Bureau of Economic Analysis
[16] Source: U.S. Bureau of Labor Statistics
[17] Source: Board of Governors of the Federal Reserve System
[18] Source: J.P.Morgan Asset Managemetn [Source: https://am.jpmorgan.com/wr/en/asset-management/institutional/insights/market-insights/investment-outlook/technology-and-ai]
[19] Hyperscalers include: Alphabet, Amazon, Meta, Microsoft, and Oracle [Source: https://www.visualcapitalist.com/visualized-big-tech-ai-spending]
Disclosures
VanderPol Investments, LLC (“VPI”) is a registered investment adviser located in Michigan. VPI may only transact business in those states in which it is registered, or qualifies for an exemption or exclusion from registration requirements.
This presentation is limited to the dissemination of general information regarding VPI’s investment advisory services. Accordingly, the information in this presentation should not be construed, in any manner whatsoever, as a substitute for personalized individual advice from VPI. Information presented is for educational purposes only and does not intend to make an offer or solicitation for the sale or purchase of any specific securities, investments, or investment strategies. Investments involve risk and unless otherwise stated, are not guaranteed. Be sure to first consult with a qualified financial adviser and/or tax professional before implementing any strategy discussed herein. Any client examples were hypothetical and used to demonstrate a concept.
Past performance is not indicative of future performance. Therefore, no current or prospective client should assume that future performance of any specific investment, investment strategy (including the investments and/or investment strategies recommended by VPI), or product referenced directly or indirectly in this presentation, will be profitable. Different types of investments involve varying degrees of risk, & there can be no assurance that any specific investment or investment strategy will suitable for a client’s or prospective client’s investment portfolio.
Various indexes were chosen that are generally recognized as indicators or representation of the stock market in general. Indices are typically not available for direct investment, are unmanaged and do not include fees or expenses. Some indices may also not reflect reinvestment of dividends.
VPI may discuss and display, charts, graphs, formulas which are not intended to be used by themselves to determine which securities to buy or sell, or when to buy or sell them. Such charts and graphs offer limited information and should not be used on their own to make investment decisions.
