
Key Takeaways
U.S. stocks reached new highs, but gains were concentrated among large companies, while many sectors declined.
Bond yields reached their highest levels in nearly two decades, offering better future income opportunities despite recent losses.
Cryptocurrencies and commodities performed strongly, while real estate struggled.
The U.S. economy remained resilient, despite persistent inflation, slow hiring, and weakness in housing.
VPI is expanding its investment approach with selective stock investments and modest tactical adjustments.
Market review
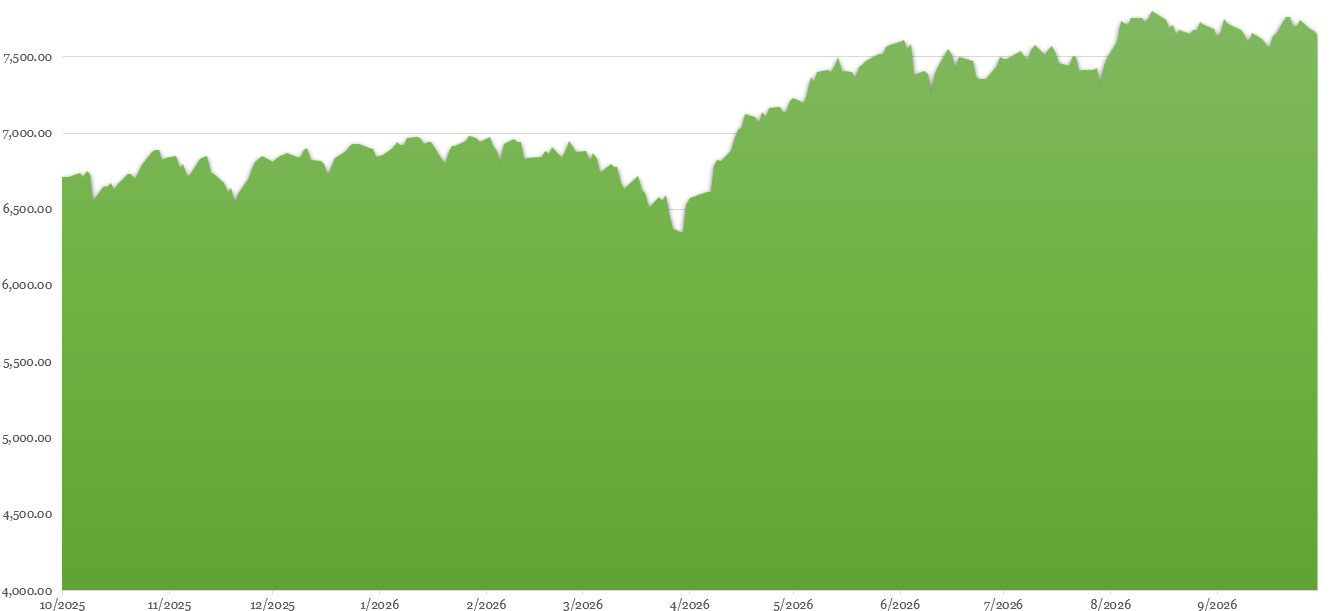
The stock market continued edging higher during the third quarter, reaching new highs despite the ongoing conflict in the Middle East, rising energy prices, and a sharp selloff in bonds. Strong corporate earnings and continued investment in artificial intelligence helped support the gains, although performance varied considerably across the market. The S&P 500 gained 2.0%, while its equal-weighted counterpart declined 2.3%[1], showing how much the largest companies contributed to overall returns. Seven of the eleven S&P 500 sectors ended the quarter lower, with Energy (+17%) and Technology (+7%) leading the gains, while Utilities (-12%), Industrials (-10%), Real Estate (-6%), and Consumer Discretionary (-5%) struggled [2].

Market Performance [Source: Quarterly Market Review – Third Quarter 2026 by Dimensional Fund Advisors] [3]
The bond market selloff intensified in September, pushing yields around the world to some of their highest levels in decades. The U.S. 10-year Treasury yield reached 5.29%[4] by the end of September, a level not seen since 2007. Inflation and Federal Reserve policy were not the only factors behind rising yields. Large government borrowing needs, along with growing corporate financing demands, particularly for AI infrastructure, added pressure as investors demanded higher returns to lend their money. While rising yields hurt recent bond returns, they also offer improved income opportunities going forward, particularly for investors seeking more stability than stocks typically provide.
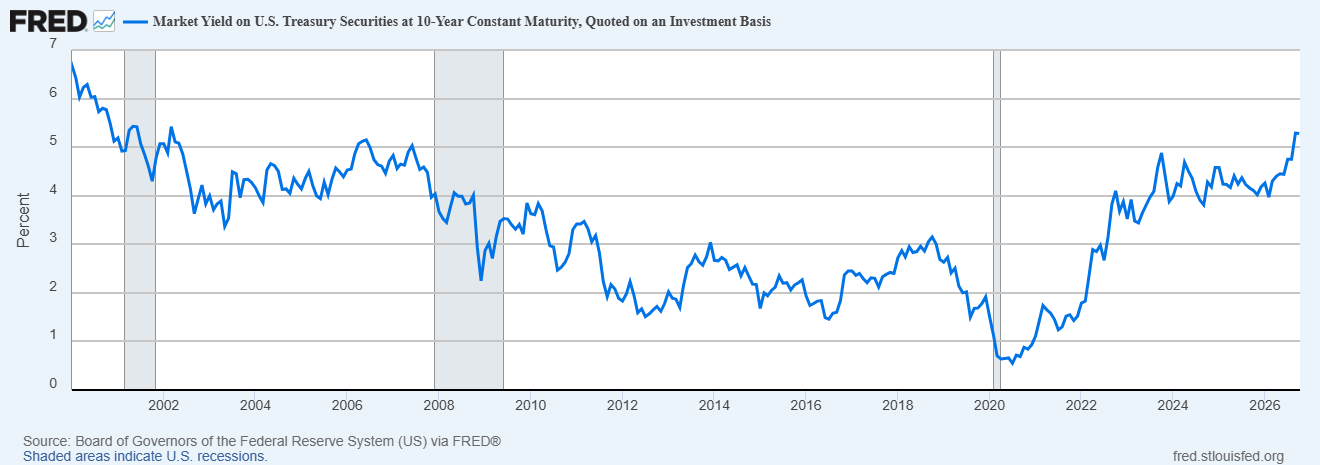
Board of Governors of the Federal Reserve System (US), Market Yield on U.S. Treasury Securities at 10-Year Constant Maturity, Quoted on an Investment Basis [DGS10], retrieved from FRED, Federal Reserve Bank of St. Louis; https://fred.stlouisfed.org/series/DGS10, October 9, 2026.
International stocks faced many of the same challenges as U.S. markets, but performance varied by region. Developed markets outside the U.S. gained 0.89% during Q3, while emerging markets declined 0.37%[5]. Japan benefited from improving corporate earnings, share buybacks, and ongoing corporate reforms. Meanwhile, Europe faced pressure from higher energy costs and interest rates, along with growing concerns over government finances. Emerging markets took a pause following their strong performance earlier in the year, although they remain among the better-performing markets year to date.
Cryptocurrencies rebounded strongly from earlier declines, with Bitcoin gaining approximately 40%[6] and Ether more than 66%[7] during Q3, supported by renewed investor interest and inflows into cryptocurrency funds. Commodities also performed well, gaining around 16%[8], largely driven by higher energy prices as conflicts in the Middle East intensified again. By contrast, real estate remained among the weakest asset classes, as rising borrowing costs continued to pressure property valuations.
The U.S. dollar strengthened toward the end of the quarter and into early October, with the Federal Reserve's broad dollar index recovering to levels last seen in late 2025[9]. Relatively strong U.S. economic growth, higher Treasury yields, and geopolitical uncertainty have supported the dollar, while energy and fiscal challenges in other major economies have added to its appeal. This rebound contrasts with ongoing concerns about dollar debasement, although strength against other currencies does not eliminate longer-term risks from inflation and government debt. Higher interest rates and the stronger dollar have also weighed on gold, which remains more than 20%[10] below its January peak, despite finishing Q3 with a modest gain.
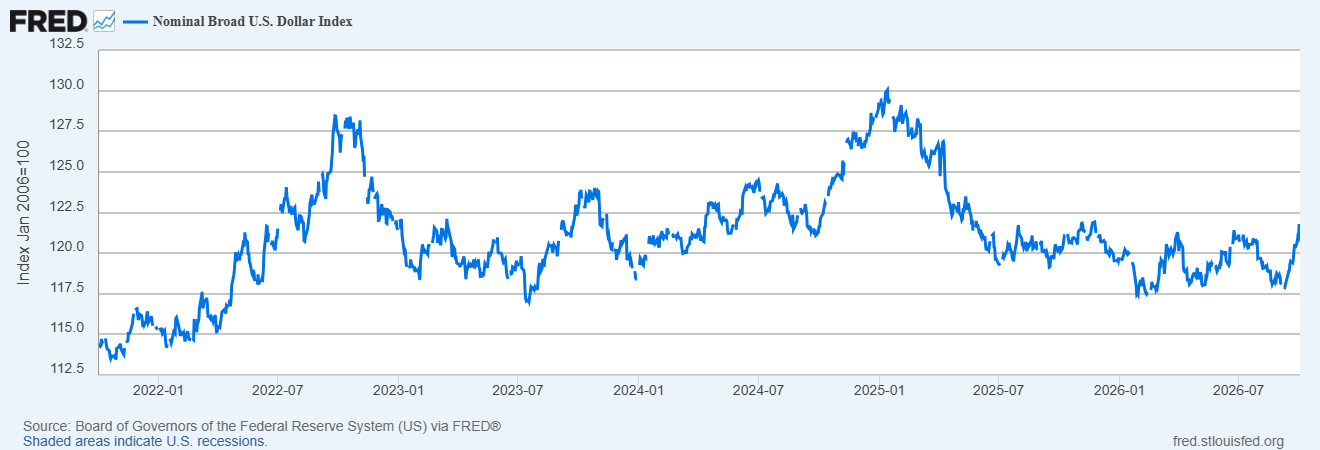
Board of Governors of the Federal Reserve System (US), Nominal Broad U.S. Dollar Index [DTWEXBGS], retrieved from FRED, Federal Reserve Bank of St. Louis; https://fred.stlouisfed.org/series/DTWEXBGS, October 9, 2026.
Economy
The U.S. economy appears to have maintained strong momentum during the third quarter, despite higher interest rates, rising energy prices, and geopolitical uncertainty. While official Q3 GDP figures have not yet been released, the Atlanta Fed estimates growth of 3.6% [11] at an annualized rate, up from 2.2% in Q2[12] and 2.5% in Q1[13]. Looking more closely at Q2, underlying domestic demand, measured by consumer spending and private fixed investment, actually accelerated from 1.8% to 4.6%[14]. This suggests the economy was stronger than headline GDP indicated, which was affected by more volatile components such as inventories and international trade. Although these factors continue to influence Q3 estimates, resilient consumer spending and business investment suggest the economy remains on relatively solid footing.
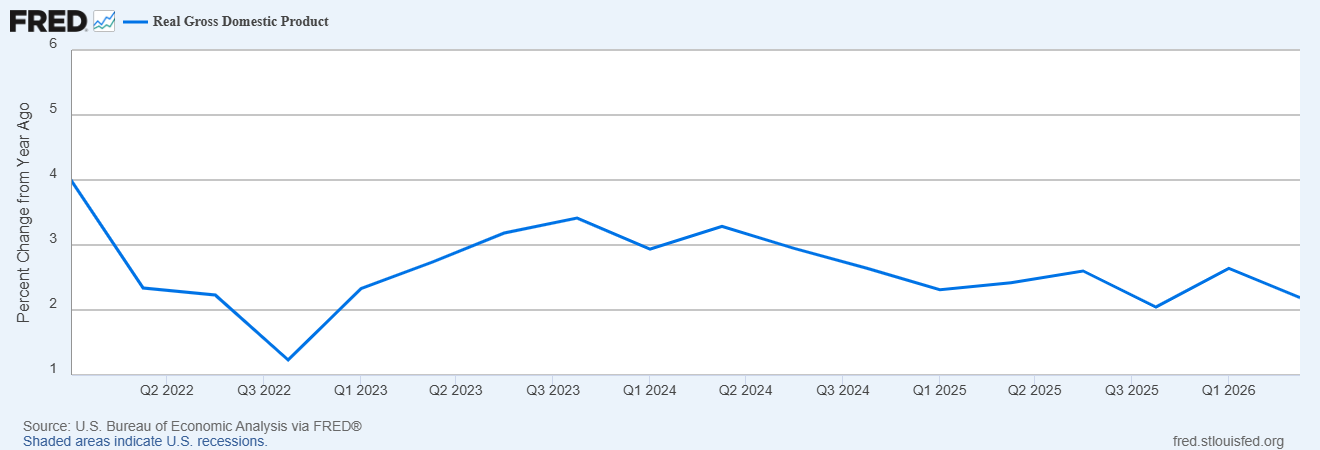
U.S. Bureau of Economic Analysis, Real Gross Domestic Product [GDPC1], retrieved from FRED, Federal Reserve Bank of St. Louis; https://fred.stlouisfed.org/series/GDPC1, October 9, 2026.
Inflation remains one of the biggest challenges. Consumer prices increased 3.4%[15] over the year through August, while core inflation, excluding food and energy, was lower at 2.4%. Energy remains the main source of pressure, with prices up 16.3% [16] from a year earlier. Diesel has become a particular concern as Russian refineries face repeated disruptions from Ukrainian attacks, while fuel production and shipments from the Middle East remain constrained by the ongoing conflict. These disruptions could prove difficult to resolve quickly, keeping transportation and production costs elevated.
Outside energy, inflation has been more moderate. Food prices rose 2.7% over the past year, shelter costs increased 3.0%, and some consumer goods like used cars experienced declining prices[17]. Home prices have also weakened, rising just 2.6%[18] through July, representing a decline after adjusting for inflation. Looking ahead, inflation could moderate next year even if energy prices remain elevated. As this year's higher prices become the basis for future comparisons, annual inflation readings would decline if prices stabilize rather than continue rising. However, this would not mean prices are returning to previous levels.
The labor market has continued to cool, although unemployment remains relatively low. September saw just 29,000 jobs added, below the prior 12 months pace that averaged monthly 45,000 [19]. Despite slower hiring, unemployment remains at 4.2%[20], and layoffs have stayed limited. Part of this disconnect can be explained by lower immigration and an aging population, which have reduced the number of new jobs needed to maintain stable unemployment.
The Federal Reserve raised its benchmark interest rate by 0.25 percentage points in September, bringing the target range to 3.75%–4.00%[21]. However, the rise in longer-term market interest rates is already doing some of the Fed's work by making borrowing more expensive and slowing activity in interest-sensitive sectors. This creates a difficult balancing act, as further rate increases could place additional pressure on weaker parts of the economy, even while inflation remains above the Fed's target.
These differences in economic performance are becoming increasingly noticeable. Investment in artificial intelligence and supporting infrastructure continues at a strong pace, with demand for computing capacity still exceeding available supply. Meanwhile, the housing market continues to struggle. Existing-home sales slowed to an annualized pace of just 3.98[22] million in August, approximately 25% below the 5.34 million homes sold annually before the pandemic in 2019[23]. Mortgage rates reached 7.28% in late September [24], nearly double their 2019 average [25], discouraging buyers while many existing homeowners are reluctant to give up their lower mortgage rates. The slowdown in housing transactions and construction affects lending, home improvement, and other related industries, illustrating how the overall economy can continue growing even while important parts of it face significant pressure.
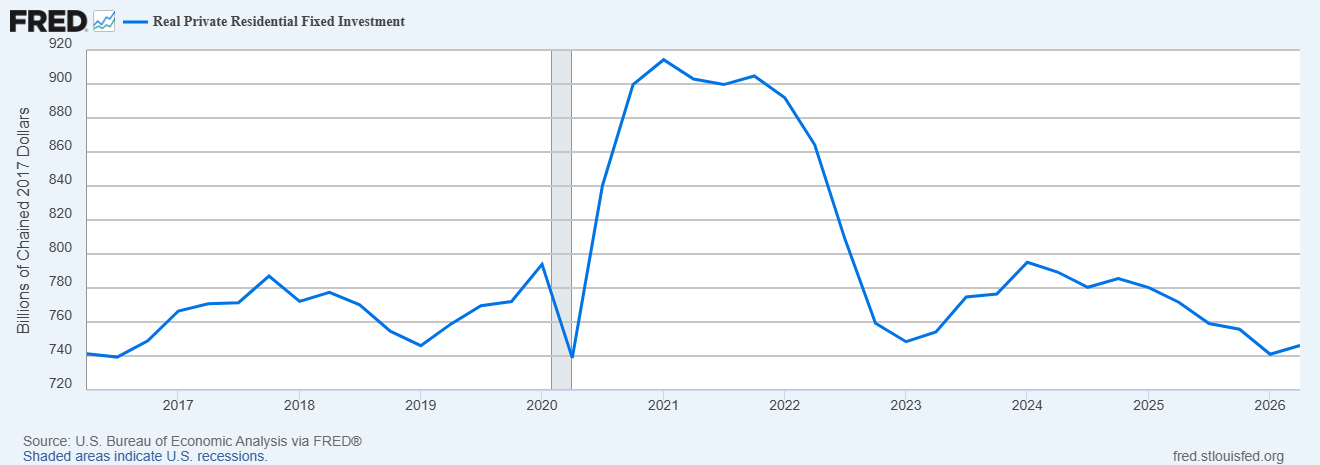
U.S. Bureau of Economic Analysis, Real Private Residential Fixed Investment [PRFIC1], retrieved from FRED, Federal Reserve Bank of St. Louis; https://fred.stlouisfed.org/series/PRFIC1, October 9, 2026.
A more selective approach
As part of our ongoing effort to become more selective and deliberate in our investment decisions, beginning in the fourth quarter we intend to pursue specific opportunities and make modest tactical adjustments when market conditions warrant them. While our long-term philosophy remains unchanged, we believe these refinements can help us add value over time, recognizing that our decisions will not always outperform broader markets.
In practice, this could mean adding modest positions in individual stocks when we see attractive opportunities over the next several years. We may also introduce investments designed to improve diversification or reduce portfolio volatility, as well as make small, temporary adjustments between stocks and bonds when valuations and market conditions suggest an opportunity.
These changes will complement our diversified, low-cost funds, which remain the foundation of our approach. In most cases, new positions will replace similar investments rather than significantly change overall portfolio risk. As always, these decisions will reflect each client's goals, risk tolerance, tax situation, and investment preferences.
Authors: Richard Toth, CFA, CAIA
References
[1] S&P Dow Jones Indices: S&P 500 Equal Weighted vs S&P 500; Price Return
[2] S&P 500 Sectors from Charles Schwab Quarterly Chart Book Q4 2026
[3] US Stock Market (Russell 3000 Index), International Developed Stocks (MSCI World ex USA Index [net dividends]), Emerging Markets (MSCI Emerging Markets Index [net dividends]),Global Real Estate (S&P Global REIT Index [net dividends]), Commodities (The Bloomberg Commodity Total Return Index), US Bond Market (Bloomberg US Aggregate Bond Index), Global Bond Market ex US (Bloomberg Global Aggregate ex-USD Bond Index [hedged to USD]), Crypto (S&P Cryptocurrency Broad Digital Asset Index [Source: https://www.spglobal.com/spdji/en/indices/digital-assets/sp-cryptocurrency-broad-digital-asset-bda-index/#overview])
[4] U.S. 10 Year Treasury [Source: https://www.cnbc.com/quotes/US10Y]
[5] International Developed Stocks (MSCI World ex USA Index [net dividends]), Emerging Markets (MSCI Emerging Markets Index [net dividends]) [Source: Quarterly Market Review – Third Quarter 2026 by Dimensional Fund Advisors]
[6] Source: Google Finance [BTC/USD] Price Change
[7] Source: Google Finance [ETH/USD] Price Change
[8] The Bloomberg Commodity Total Return Index [Source: Quarterly Market Review – Third Quarter 2026 by Dimensional Fund Advisors]
[9] Board of Governors of the Federal Reserve System (US), Nominal Broad U.S. Dollar Index [DTWEXBGS], retrieved from FRED, Federal Reserve Bank of St. Louis; https://fred.stlouisfed.org/series/DTWEXBGS, October 9, 2026.
[10] Source: Google Finance [Gold/USD] Price Change
[11] Federal Reserve Bank of Atlanta’s GDPNow as of October 8, 2026
[12-14] Source: U.S. Bureau of Economic Analysis
[15-17] Source: U.S. Bureau of Labor Statistics
[18] S&P Dow Jones Indices LLC, S&P Cotality Case-Shiller U.S. National Home Price Index [CSUSHPINSA], retrieved from FRED, Federal Reserve Bank of St. Louis; https://fred.stlouisfed.org/series/CSUSHPINSA, October 9, 2026.
[19-20] Source: U.S. Bureau of Labor Statistics
[21] Source: Board of Governors of the Federal Reserve System [https://www.federalreserve.gov/monetarypolicy/openmarket.htm]
[22] Source: National Association of REALTORS [https://www.nar.realtor/newsroom/nar-existing-home-sales-report-shows-2-0-decrease-in-august]
[23] Source: National Association of REALTORS [https://www.nar.realtor/sites/default/files/documents/real-estate-and-economic-outlook-midyear-nar-forecast-summit-lawrence-yun-presentation-slides-07-22-2024.pdf]
[24] 30-Yr FRM U.S. weekly averages week ending 10/01/2026 [Source: https://www.freddiemac.com/pmms]
[25] Average 30 Year Fixed Mortgage Rate [Source: https://freddiemac.gcs-web.com/news-releases/news-release-details/little-change-mortgage-rates-0/]
Disclosures
VanderPol Investments, LLC (“VPI”) is a registered investment adviser located in Michigan. VPI may only transact business in those states in which it is registered, or qualifies for an exemption or exclusion from registration requirements.
This presentation is limited to the dissemination of general information regarding VPI’s investment advisory services. Accordingly, the information in this presentation should not be construed, in any manner whatsoever, as a substitute for personalized individual advice from VPI. Information presented is for educational purposes only and does not intend to make an offer or solicitation for the sale or purchase of any specific securities, investments, or investment strategies. Investments involve risk and unless otherwise stated, are not guaranteed. Be sure to first consult with a qualified financial adviser and/or tax professional before implementing any strategy discussed herein. Any client examples were hypothetical and used to demonstrate a concept.
Past performance is not indicative of future performance. Therefore, no current or prospective client should assume that future performance of any specific investment, investment strategy (including the investments and/or investment strategies recommended by VPI), or product referenced directly or indirectly in this presentation, will be profitable. Different types of investments involve varying degrees of risk, & there can be no assurance that any specific investment or investment strategy will suitable for a client’s or prospective client’s investment portfolio.
Various indexes were chosen that are generally recognized as indicators or representation of the stock market in general. Indices are typically not available for direct investment, are unmanaged and do not include fees or expenses. Some indices may also not reflect reinvestment of dividends.
VPI may discuss and display, charts, graphs, formulas which are not intended to be used by themselves to determine which securities to buy or sell, or when to buy or sell them. Such charts and graphs offer limited information and should not be used on their own to make investment decisions.
